The mode of a dataset represents the value that occurs most often.
To find the mode in a histogram, we can use the following steps:
1. Identify the tallest bar.
2. Draw a line from the left corner of the tallest bar to the left corner of the bar immediately after it.
3. Draw a line from the right corner of the tallest bar to the right corner of the bar immediately before it.
4. Identify the point where the two lines intersect. Then draw a line straight down to the x-axis. The point where the line hits the x-axis is our best estimate for the mode.
The following step-by-step example shows how to find the mode of the following histogram:
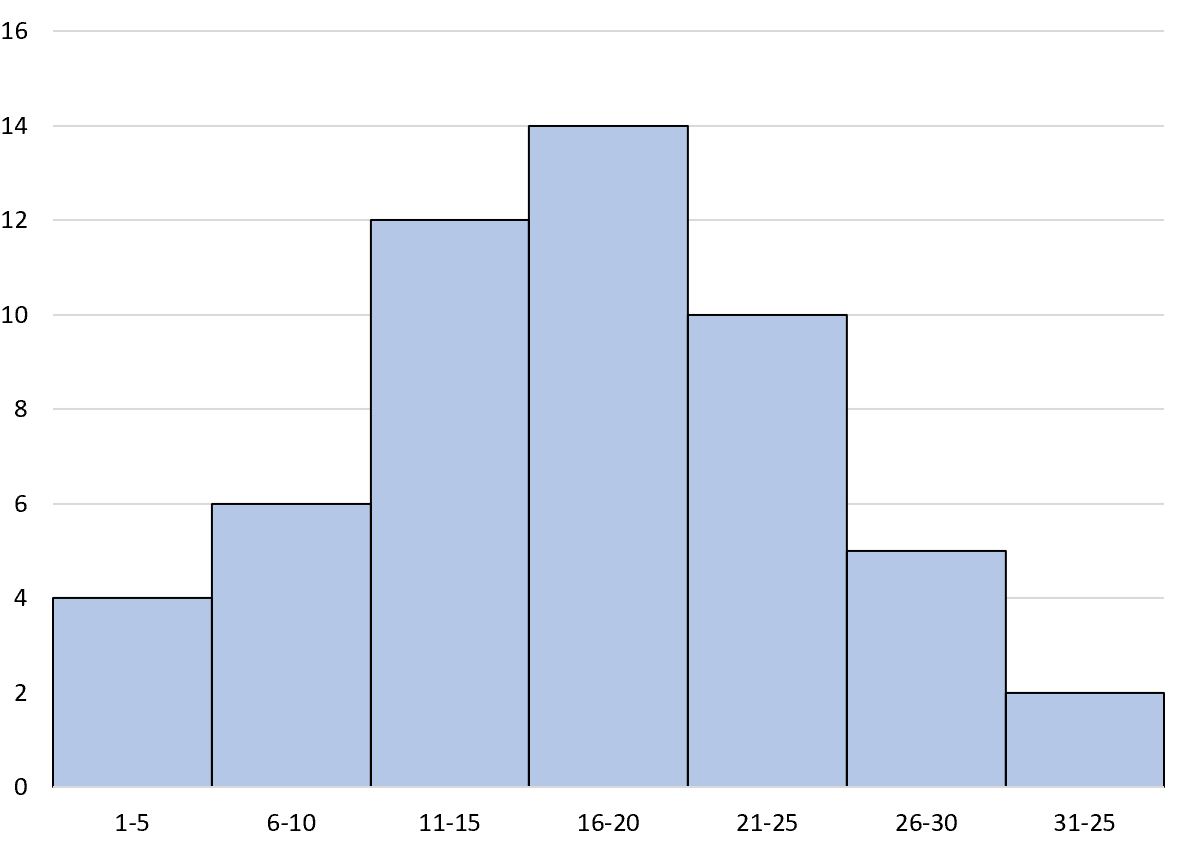
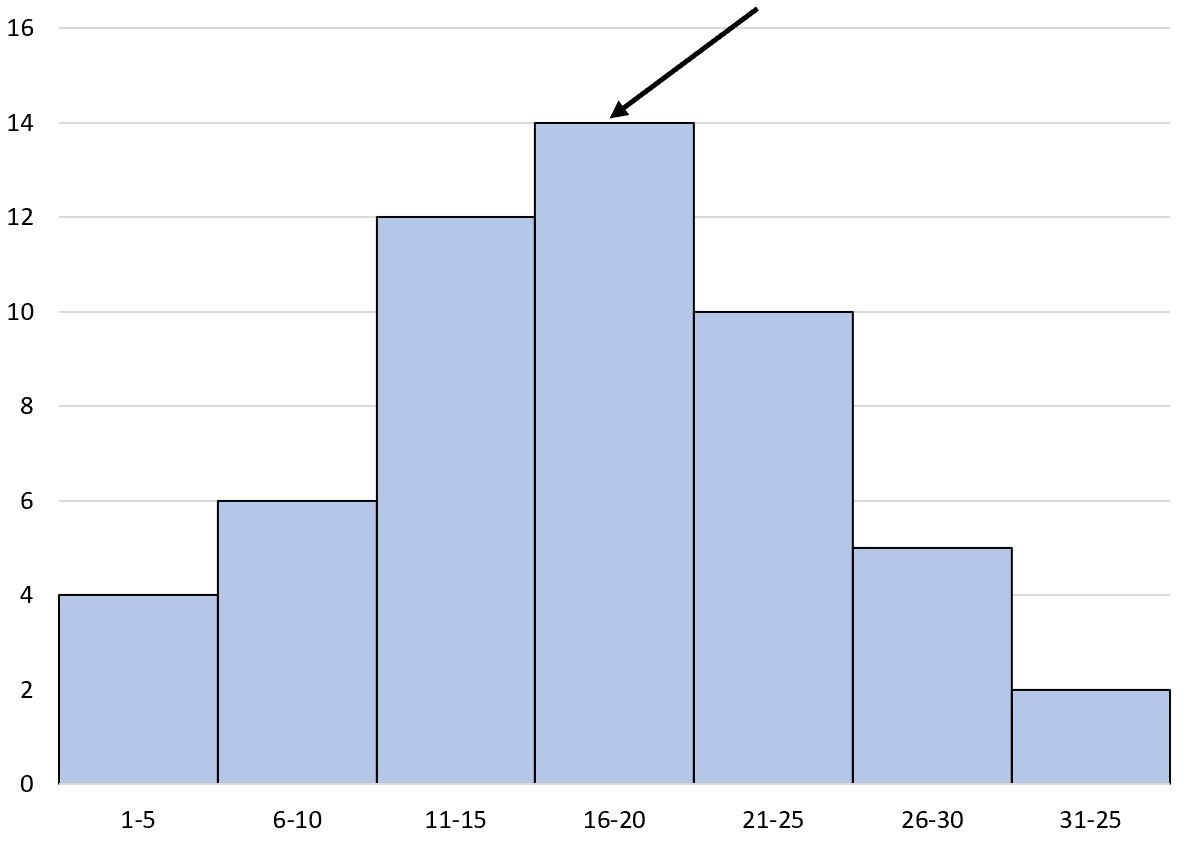
Step 1: Identify the Tallest Bar
First, we need to identify the tallest bar in the histogram.
This is the bar with the bin range of 16 to 20:
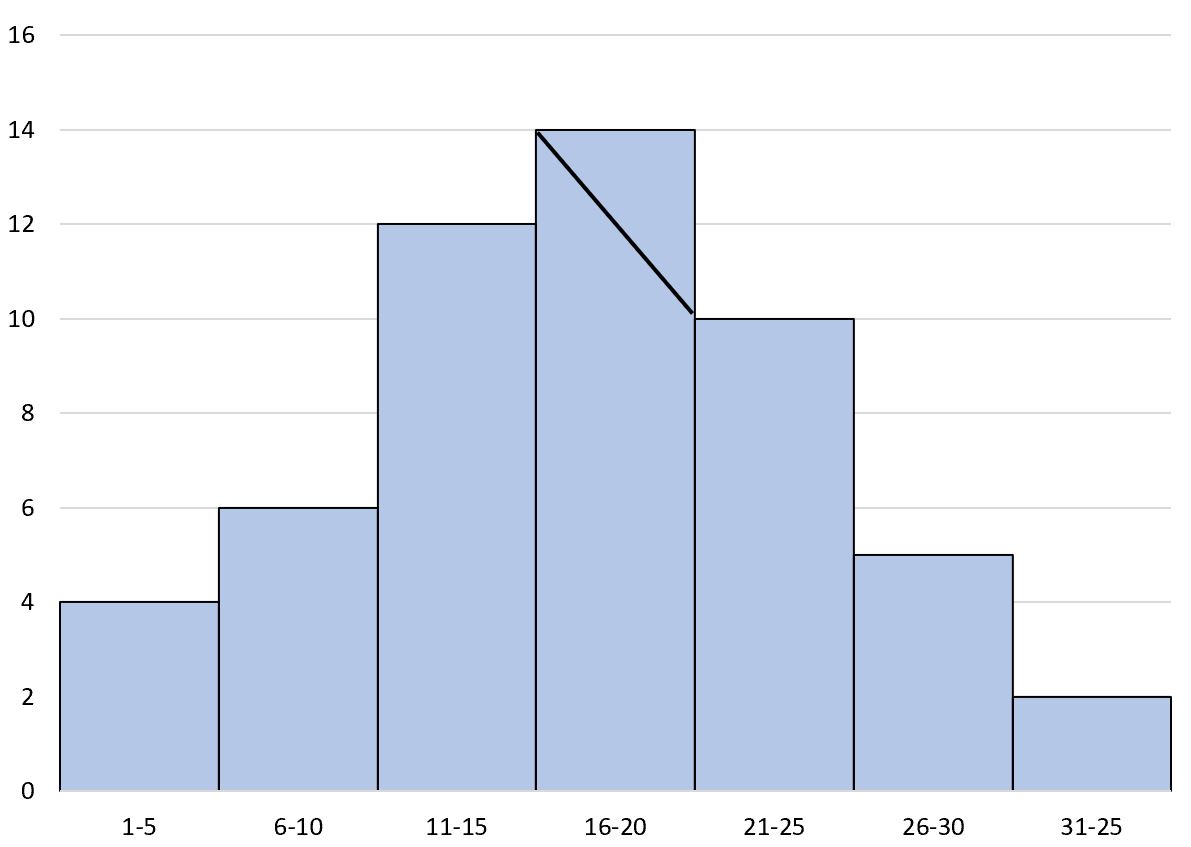
Step 2: Draw the First Line
Next, we need to draw a line from the left corner of the tallest bar to the left corner of the bar immediately after it:
Step 3: Draw the Second Line
Next, we need to draw a line from the right corner of the tallest bar to the right corner of the bar immediately before it:
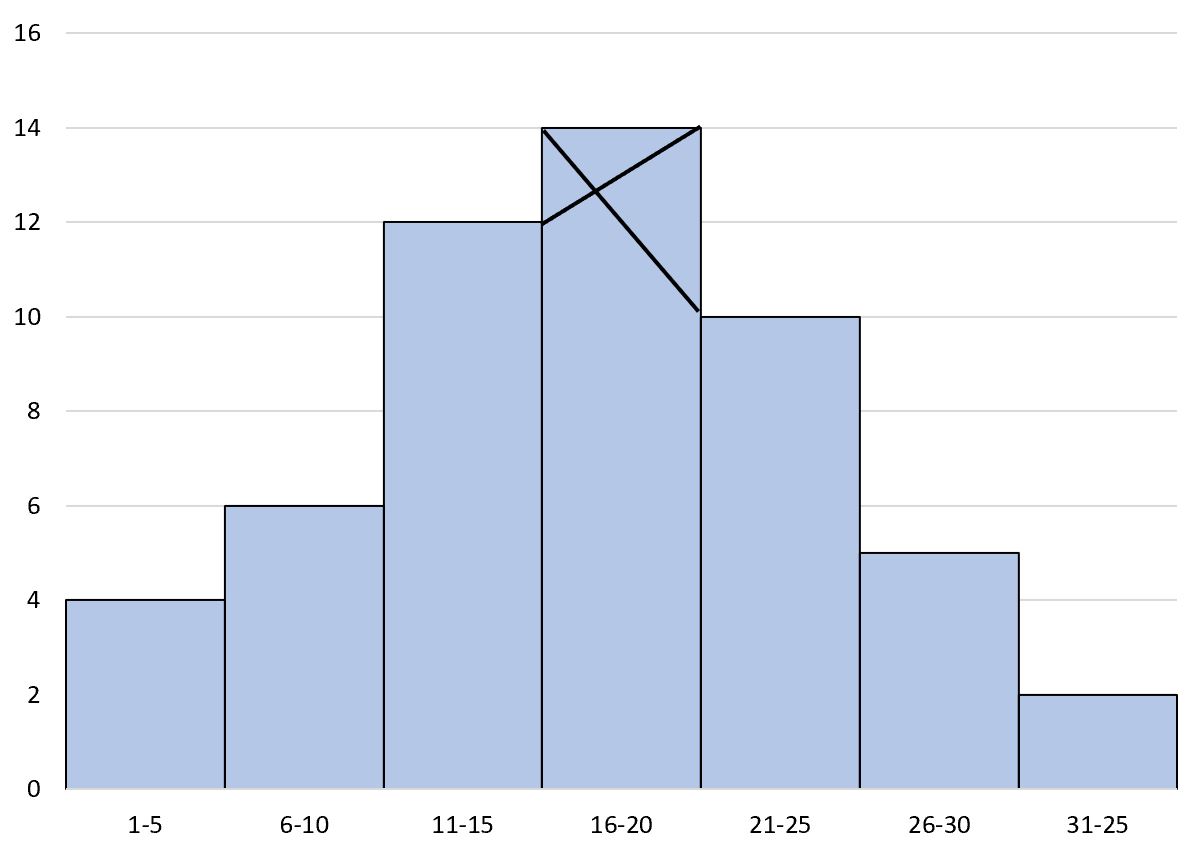
Step 4: Identify the Point of Intersection
Next, we need to identify the point where the two lines intersect. Then draw a line straight down to the x-axis:
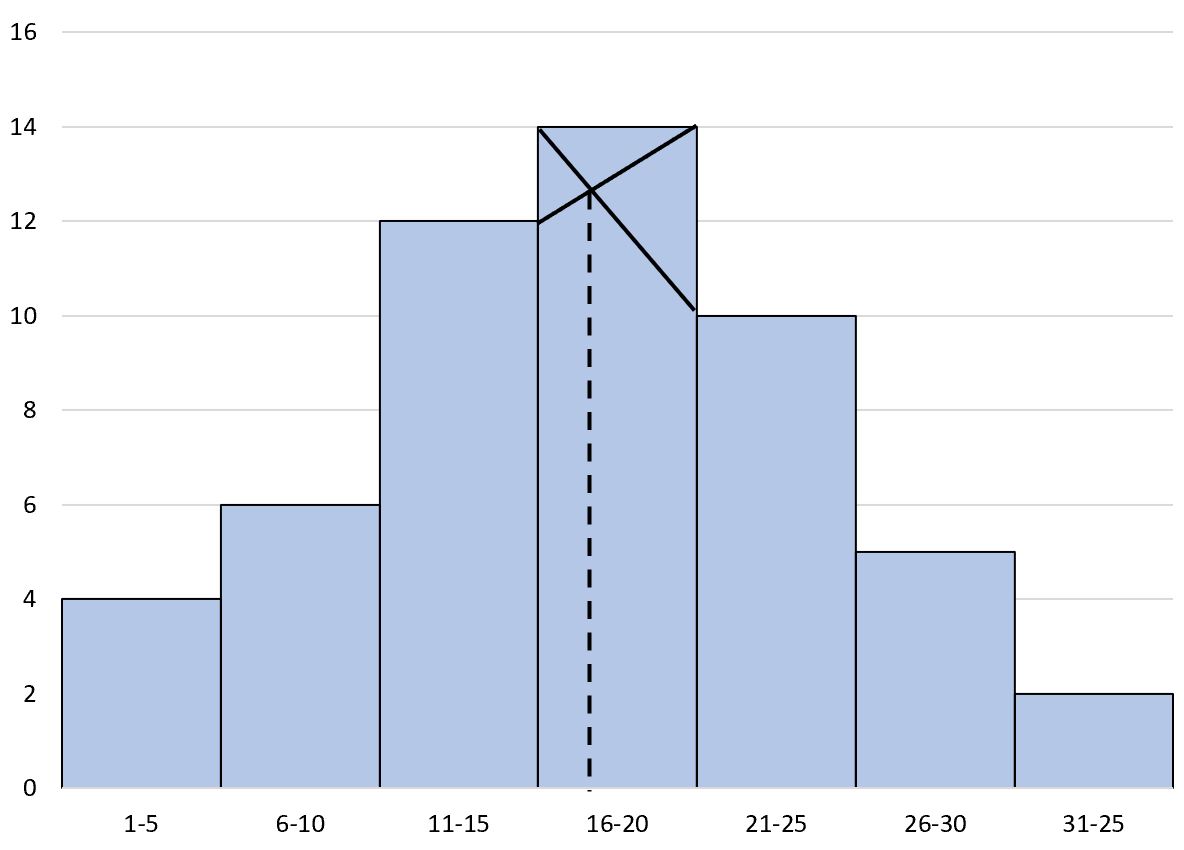
The point where the line hits the x-axis is our best estimate for the mode.
In this example, our best estimate for the mode is roughly 17.
Note: Since the data in a histogram is grouped into bins, it’s not possible to know the exact value of the mode but the method that we used here allows us to make our best estimate.
Additional Resources
The following tutorials explain how to perform other common tasks involving histograms:
How to Estimate the Mean and Median of Any Histogram
How to Estimate the Standard Deviation of Any Histogram
How to Compare Histograms