A Kruskal-Wallis Test is used to determine whether or not there is a statistically significant difference between the medians of three or more independent groups. It is considered to be the non-parametric equivalent of the One-Way ANOVA.
This tutorial explains how to conduct a Kruskal-Wallis Test in SPSS.
Example: Kruskal-Wallis Test in SPSS
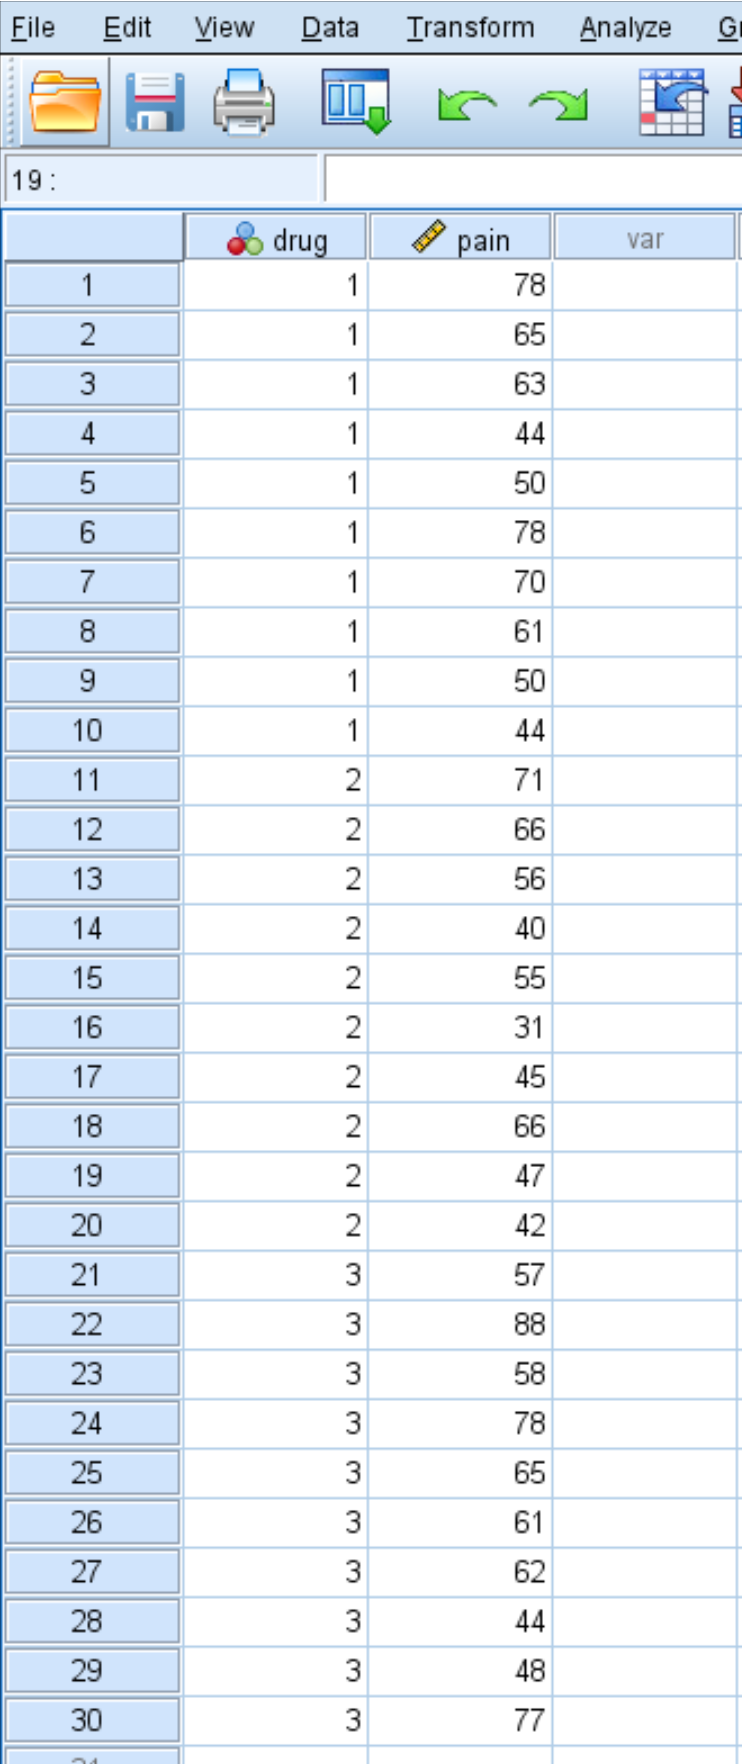
A researcher wants to know whether or not three drugs have different effects on knee pain, so he recruits 30 individuals who all experience similar knee pain and randomly splits them up into three groups to receive either Drug 1, Drug 2, or Drug 3.
After one month of taking the drug, the researcher asks each individual to rate their knee pain on a scale of 1 to 100, with 100 indicating the most severe pain. The ratings for all 30 individuals are shown below:
Use the following steps to perform a Kruskal-Wallis Test to determine whether or not there is a difference between the reported levels of knee pain between the three groups:
Step 1: Perform a Kruskal-Wallis Test.
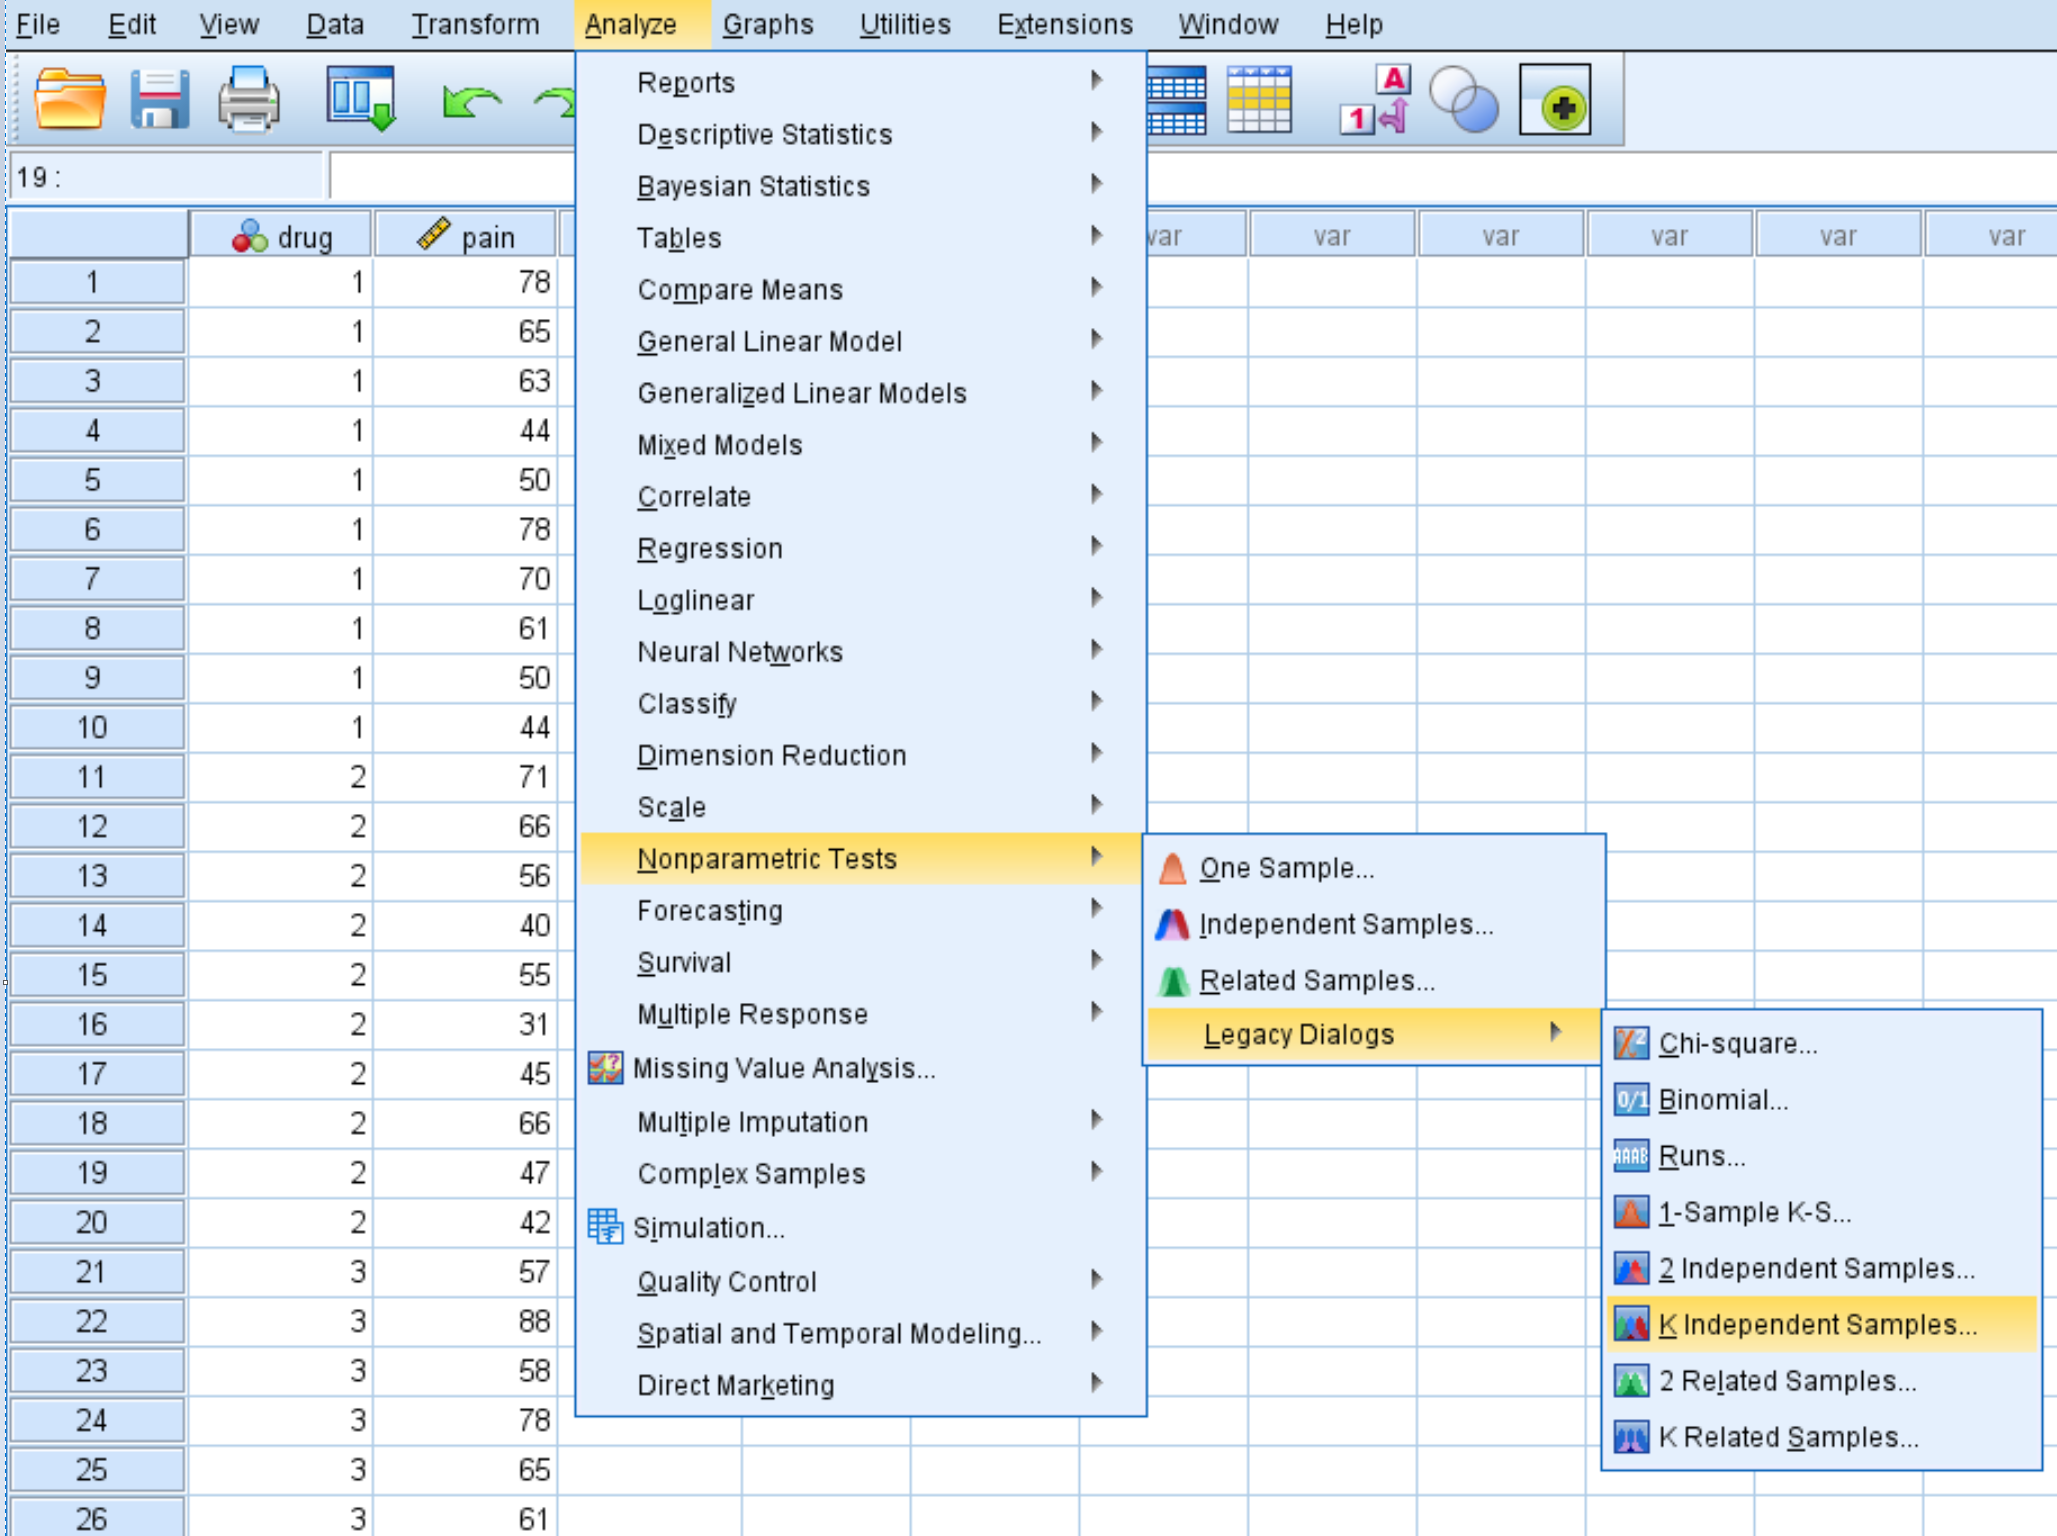
Click the Analyze tab, then Nonparametric Tests, then Legacy Dialogs, then K Independent Samples:
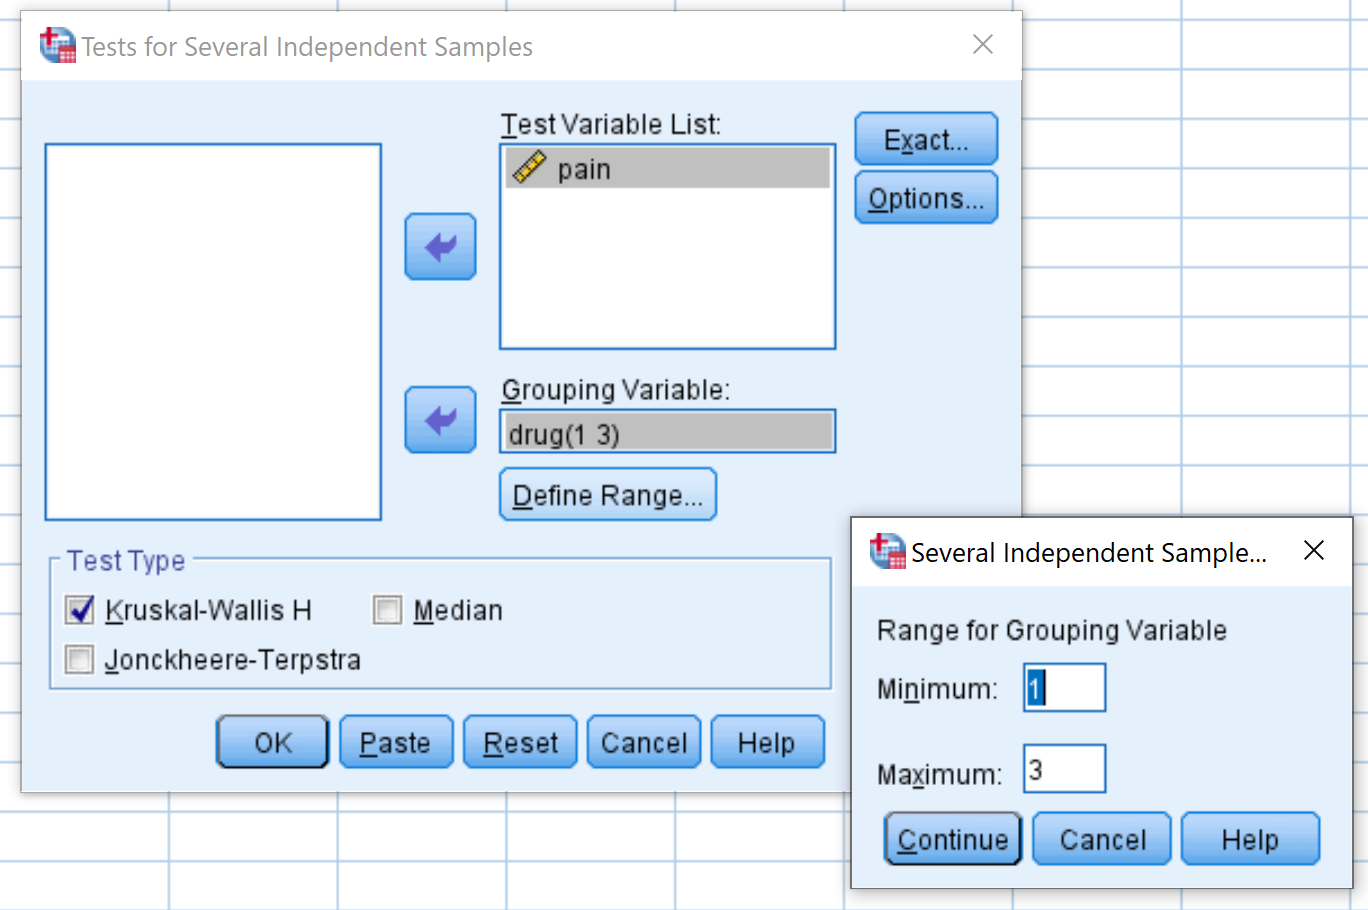
In the window that pops up, drag the variable pain into the box labelled Test Variable List and drug into the box labelled Grouping Variable. Then click Define Range and set the Minimum value to 1 and the Maximum value to 3. Then click Continue. Make sure the box is checked next to Kruskal-Wallis H and then click OK.
Step 2: Interpret the results.
Once you click OK, the results of the Kruskal-Wallis test will appear:
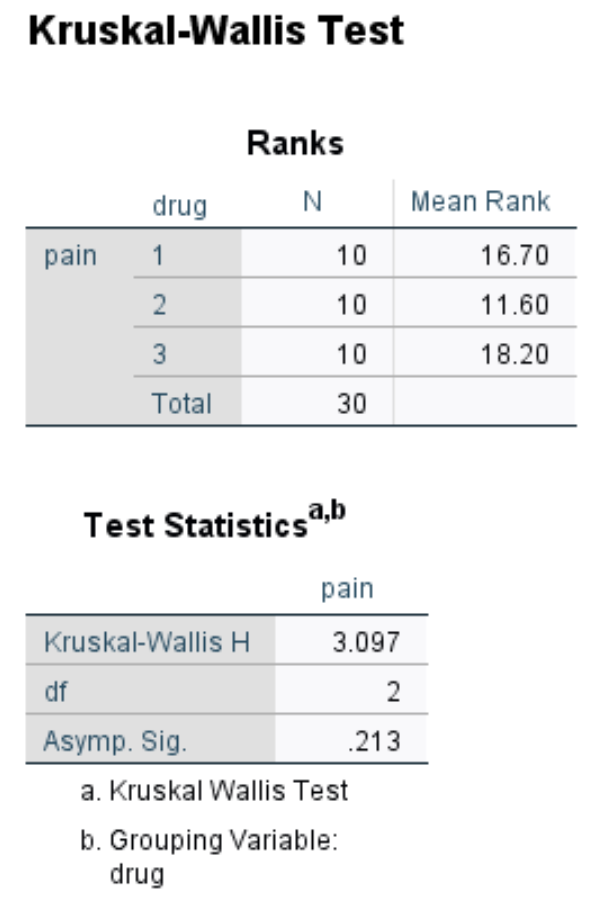
The second table in the output displays the results of the test:
- Kruskal-Wallis H: This is the X2 test statistic.
- df: This is the degrees of freedom, calculated as #groups-1 = 3-1 = 2.
- Asymp. Sig: This is the p-value associated with a X2 test statistic of 3.097 with 2 degrees of freedom. This can also be found by using the Chi-Square Score to P Value Calculator.
Since the p-value (.213) is not less than .05, we fail to reject the null hypothesis. We do not have sufficient evidence to say that there is a statistically significant difference between the knee pain ratings across these three groups.