A confidence interval for a correlation coefficient is a range of values that is likely to contain a population correlation coefficient with a certain level of confidence.
This tutorial explains the following:
- The motivation for creating this type of confidence interval.
- The formula to create this type of confidence interval.
- An example of how to create this type of confidence interval.
- How to interpret this type of confidence interval.
Confidence Interval for a Correlation Coefficient: Motivation
The reason to create a confidence interval for a correlation coefficient is to capture our uncertainty when estimating a population correlation coefficient.
For example, suppose we want to estimate the correlation coefficient between height and weight of residents in a certain county. Since there are thousands of residents in the county, it would be too costly and time-consuming to go around and gather information on every resident’s height and weight.
Instead, we might select a simple random sample of residents and simply gather information about them.
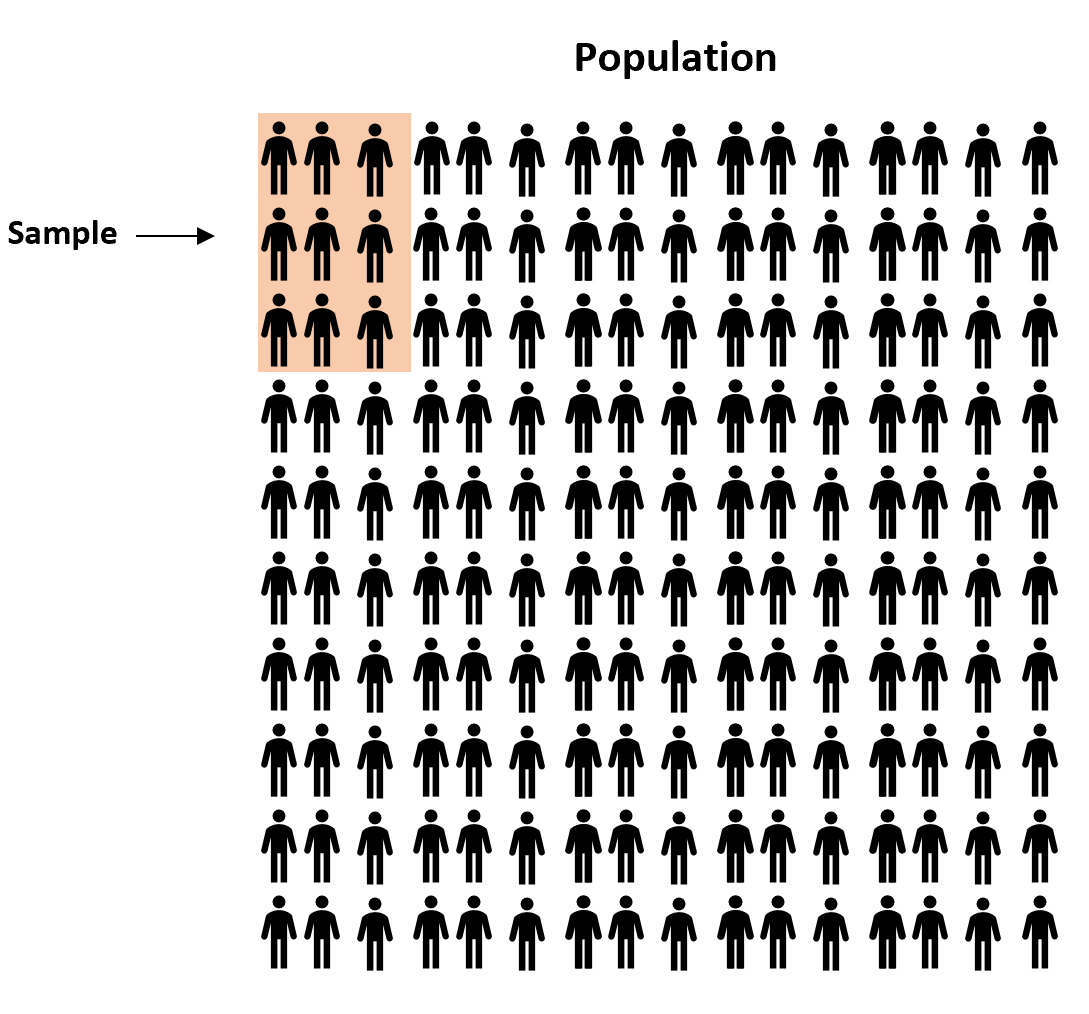
Since we select a random sample of residents, there is no guarantee that the correlation coefficient between height and weight for these residents in the sample will exactly match the correlation coefficient in the larger population.
So, to capture this uncertainty we can create a confidence interval that contains a range of values that are likely to contain the true correlation coefficient between height and weight of residents in this county.
Confidence Interval for a Correlation Coefficient: Formula
We use the following steps to calculate a confidence interval for a population correlation coefficient, based on sample size n and sample correlation coefficient r.
Step 1: Perform Fisher transformation.
Let zr = ln((1+r) / (1-r)) / 2
Step 2: Find log upper and lower bounds.
Let L = zr – (z1-α/2 /√n-3)
Let U = zr + (z1-α/2 /√n-3)
Step 3: Find confidence interval.
The final confidence interval can be found using the following formula:
Confidence interval = [(e2L-1)/(e2L+1), (e2U-1)/(e2U+1)]
Confidence Interval for a Correlation Coeffficient: Example
Suppose we want to estimate the correlation coefficient between height and weight of residents in a certain county. We select a random sample of 30 residents and find the following information:
- Sample size n = 30
- Correlation coefficient between height and weight r = 0.56
Here is how to find a 95% confidence interval for the population correlation coefficient:
Step 1: Perform Fisher transformation.
Let zr = ln((1+r) / (1-r)) / 2 = ln((1+.56) / (1-.56)) / 2 = 0.6328
Step 2: Find log upper and lower bounds.
Let L = zr – (z1-α/2 /√n-3) = .6328 – (1.96 /√30-3) = .2556
Let U = zr + (z1-α/2 /√n-3) = .6328 + (1.96 /√30-3) = 1.01
Step 3: Find confidence interval.
Confidence interval = [(e2L-1)/(e2L+1), (e2U-1)/(e2U+1)]
Confidence interval = [(e2(.2556)-1)/(e2(.2556)+1), (e2(1.01)-1)/(e2(1.01)+1)] = [.2502, .7658]
Note: You can also find this confidence interval by using the Confidence Interval for a Correlation Coefficient Calculator.
Confidence Interval for a Correlation Coefficient: Interpretation
The way we would interpret a confidence interval is as follows:
There is a 95% chance that the confidence interval of [.2502, .7658] contains the true population correlation coefficient between height and weight of residents in this county.
Another way of saying the same thing is that there is only a 5% chance that the true population correlation coefficient lies outside of the 95% confidence interval.
That is, there’s only a 5% chance that the true population correlation coefficient between height and weight of residents in this county is less than .2502 or greater than .7658.