You can use the following methods to adjust the thickness of the lines in a boxplot in ggplot2:
Method 1: Adjust Thickness of All Lines
ggplot(df, aes(x=x, y=y)) +
  geom_boxplot(lwd=2)
Method 2: Adjust Thickness of Median Line Only
ggplot(df, aes(x=x, y=y)) +
  geom_boxplot(fatten=4)
The following examples show how to use each method in practice with the following data frame in R:
#make this example reproducible
set.seed(1)

#create data frame
df A', 'B', 'C'), each=100),
                 points=c(rnorm(100, mean=10),
                          rnorm(100, mean=15),
                          rnorm(100, mean=20)))

#view head of data frame
head(df)

  team    points
1    A  9.373546
2    A 10.183643
3    A  9.164371
4    A 11.595281
5    A 10.329508
6    A  9.179532
Note: We used the set.seed() function to ensure that this example is reproducible.
Example 1: Create Boxplot with Default Line Thickness
The following code shows how to create a boxplot to visualize the distribution of points grouped by team, using the default line thickness:
library(ggplot2)

#create box plots to visualize distribution of points by team
ggplot(df, aes(x=team, y=points)) +
  geom_boxplot()

Example 2: Create Boxplot with Increased Line Thickness
The following code shows how to create a boxplot to visualize the distribution of points grouped by team, using the lwd argument to increase the thickness of all lines in the boxplot:
library(ggplot2)

#create box plots with increased line thickness
ggplot(df, aes(x=team, y=points)) +
  geom_boxplot(lwd=2)
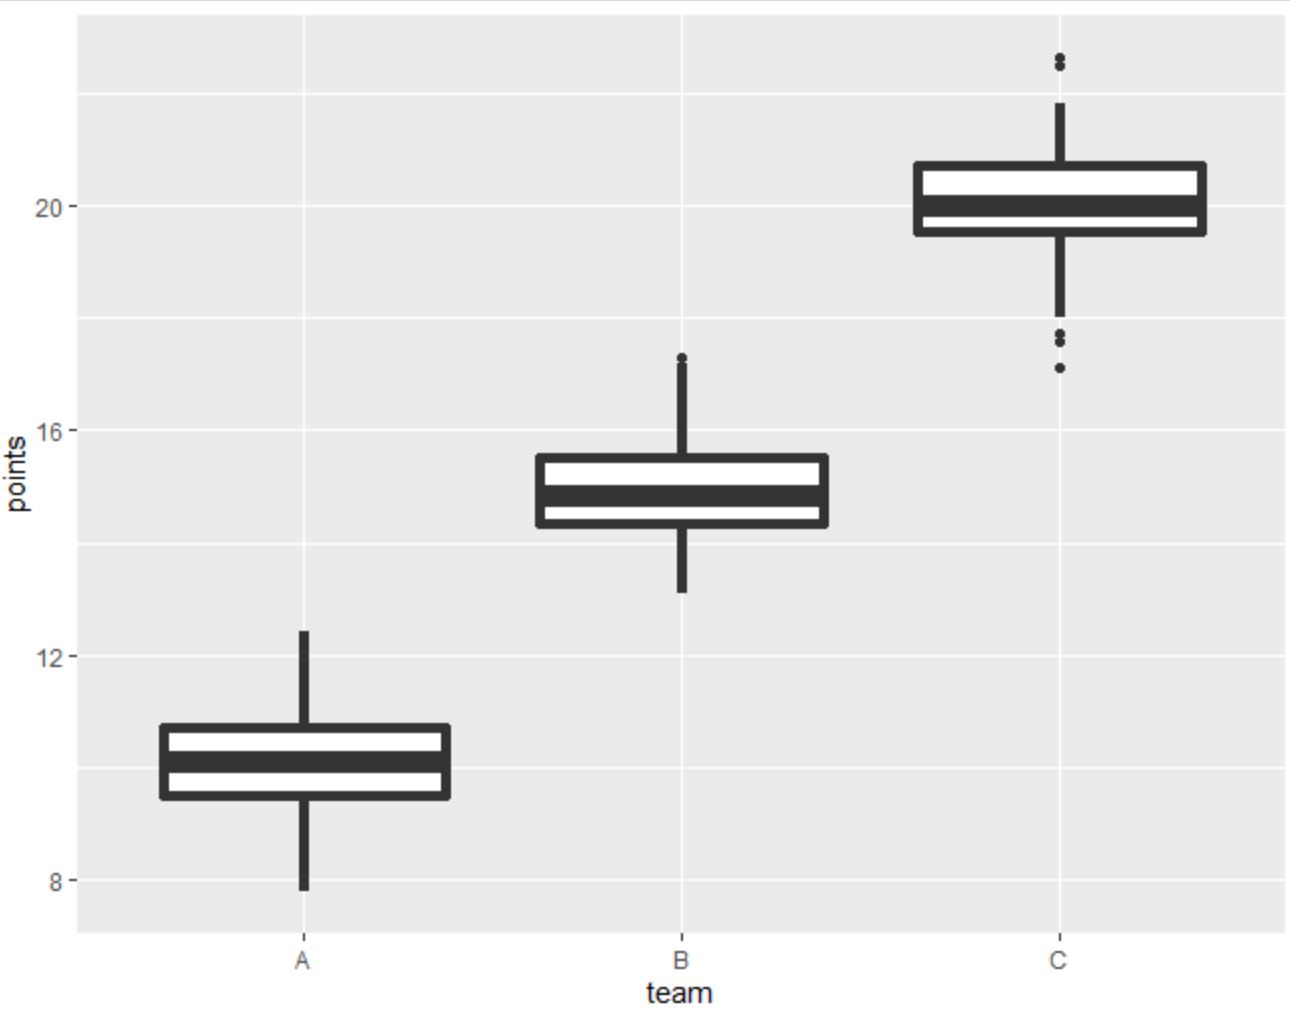
Notice that the thickness of each of the lines in each boxplot has increased.
Example 3: Create Boxplot with Increased Line Thickness of Median Line Only
The following code shows how to create a boxplot to visualize the distribution of points grouped by team, using the fatten argument to increase the thickness of the median line in each boxplot:
library(ggplot2)

#create box plots with increased median line thickness
ggplot(df, aes(x=team, y=points)) +
  geom_boxplot(fatten=4)
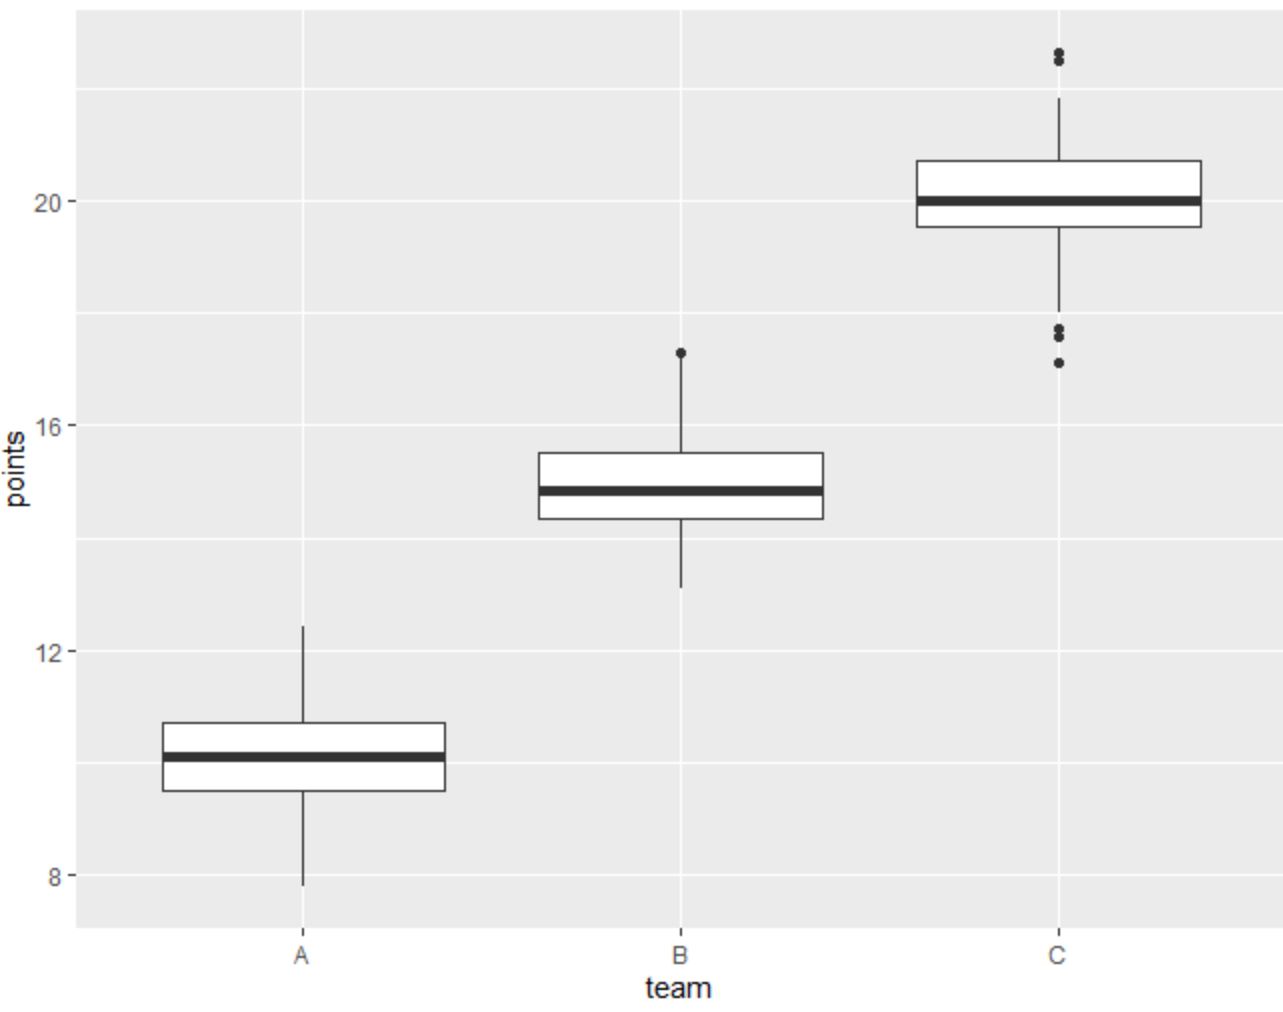
Notice that only the thickness of the median line in each boxplot has increased.
Feel free to play around with both the lwd and fatten arguments in geom_boxplot() to create boxplots that have the exact line thickness you’d like.
Additional Resources
The following tutorials explain how to perform other common tasks in R:
How to Change Axis Labels of Boxplot in ggplot2
How to Create a Grouped Boxplot in ggplot2
How to Label Outliers in Boxplots in ggplot2