In the field of machine learning, we often build models so that we can make accurate predictions about some phenomenon.
For example, suppose we want to build a regression model that uses the predictor variable hours spent studying to predict the response variable ACT score for students in high school.
To build this model, we’ll collect data about hours spent studying and the corresponding ACT Score for hundreds of students in a certain school district.
Then we’ll use this data to train a model that can make predictions about the score a given student will receive based on their total hours studied.
To assess how useful the model is, we can measure how well the model predictions match the observed data. One of the most commonly used metrics for doing so is the mean squared error (MSE), which is calculated as:
MSE = (1/n)*Σ(yi – f(xi))2
where:
- n: Total number of observations
- yi: The response value of the ith observation
- f(xi): The predicted response value of the ith observation
The closer the model predictions are to the observations, the smaller the MSE will be.
However, one of the biggest mistakes made in machine learning is optimizing models to reduce training MSE – i.e. how closely the model predictions match up with the data that we used to train the model.
When a model focuses too much on reducing training MSE, it often works too hard to find patterns in the training data that are just caused by random chance. Then when the model is applied to unseen data, it performs poorly.
This phenomenon is known as overfitting. It occurs when we “fit” a model too closely to the training data and we thus end up building a model that isn’t useful for making predictions about new data.
Example of Overfitting
To understand overfitting, let’s return to the example of creating a regression model that uses hours spent studying to predict ACT score.
Suppose we gather data for 100 students in a certain school district and create a quick scatterplot to visualize the relationship between the two variables:
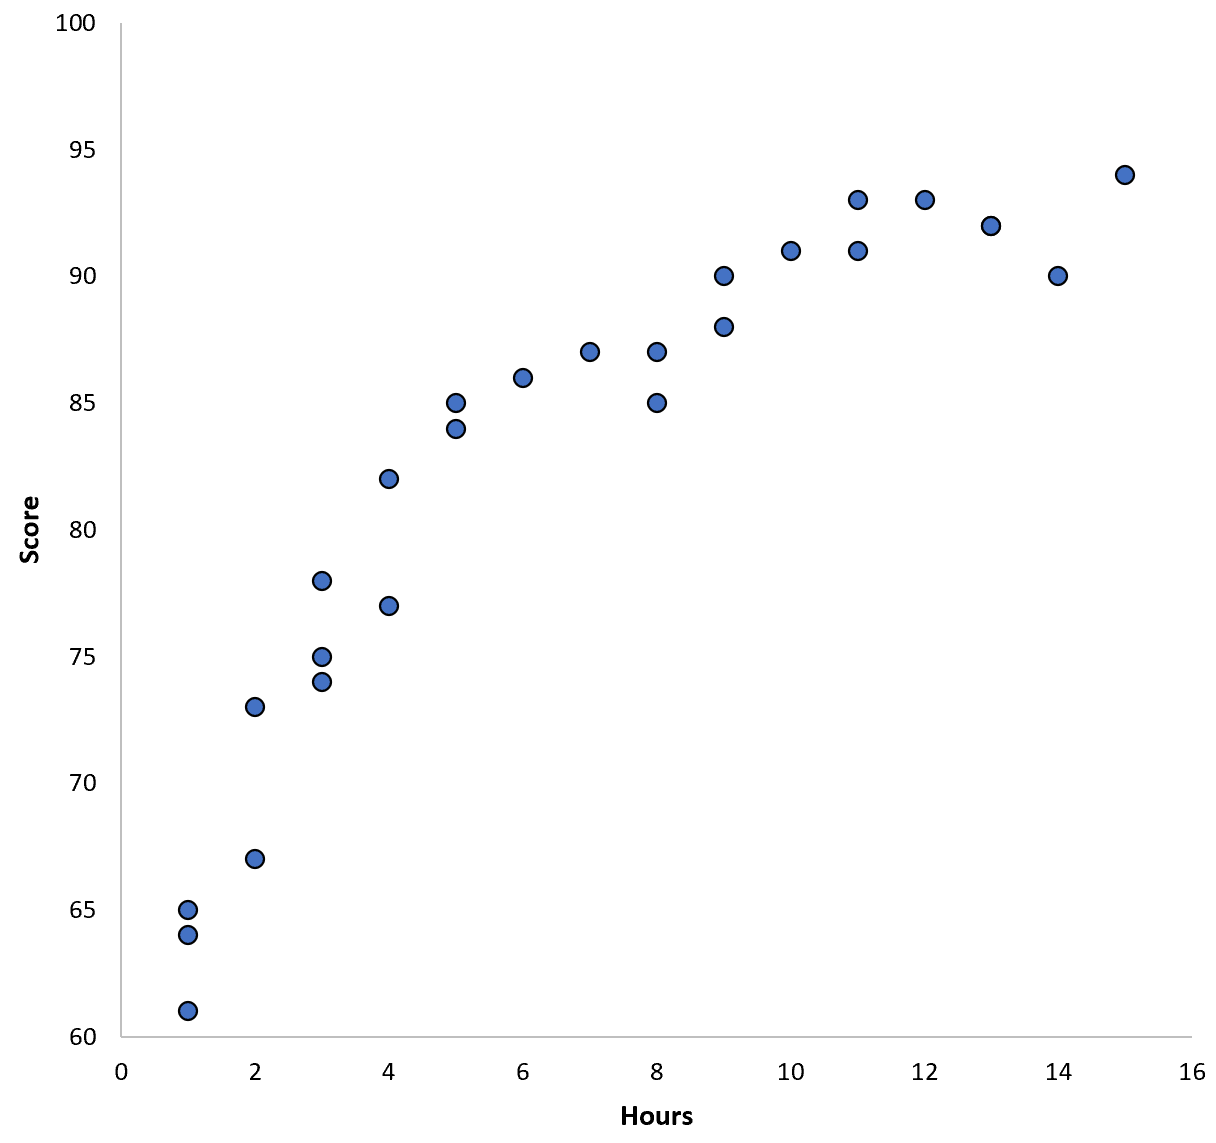
The relationship between the two variables appears to be quadratic, so suppose we fit the following quadratic regression model:
Score = 60.1 + 5.4*(Hours) – 0.2*(Hours)2
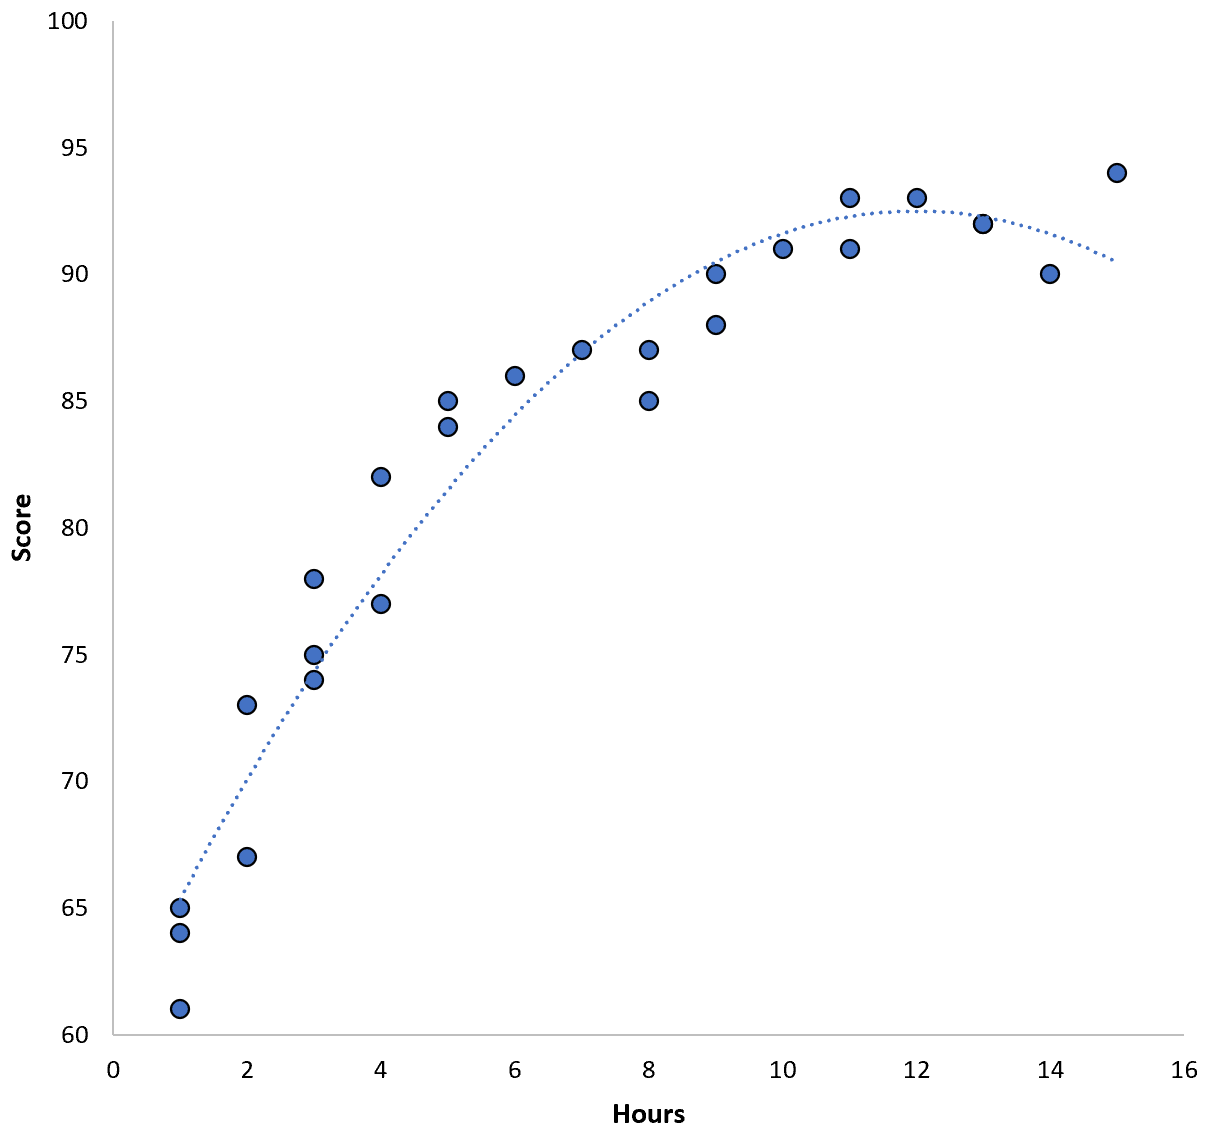
This model has a training mean squared error (MSE) of 3.45. That is, the mean squared difference between the predictions made by the model and the actual ACT scores is 3.45.
However, we could reduce this training MSE by fitting a higher-order polynomial model. For example, suppose we fit the following model:
Score = 64.3 – 7.1*(Hours) + 8.1*(Hours)2 – 2.1*(Hours)3 + 0.2*(Hours)4 – 0.1*(Hours)5 + 0.2(Hours)6

Notice how the regression line hugs the actual data much more closely than the previous regression line.
This model has a training mean squared error (MSE) of just 0.89. That is, the mean squared difference between the predictions made by the model and the actual ACT scores is 0.89.
This training MSE is much smaller than the one produced by the previous model.
However, we don’t really care about the training MSE – i.e. how closely the model predictions match up with the data that we used to train the model. Instead, we care mostly about the test MSE – the MSE when our model is applied to unseen data.
If we applied the higher-order polynomial regression model above to an unseen dataset, it would likely perform worse than the simpler quadratic regression model. That is, it would produce a higher test MSE which is exactly what we don’t want.
How to Detect & Avoid Overfitting
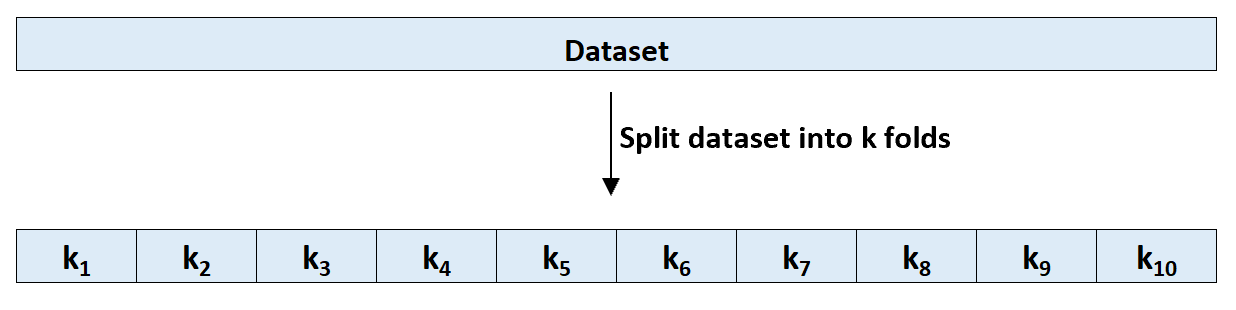
The easiest way to detect overfitting is to perform cross-validation. The most commonly used method is known as k-fold cross validation and it works as follows:
Step 1: Randomly divide a dataset into k groups, or “folds”, of roughly equal size.
Step 2: Choose one of the folds to be the holdout set. Fit the model on the remaining k-1 folds. Calculate the test MSE on the observations in the fold that was held out.
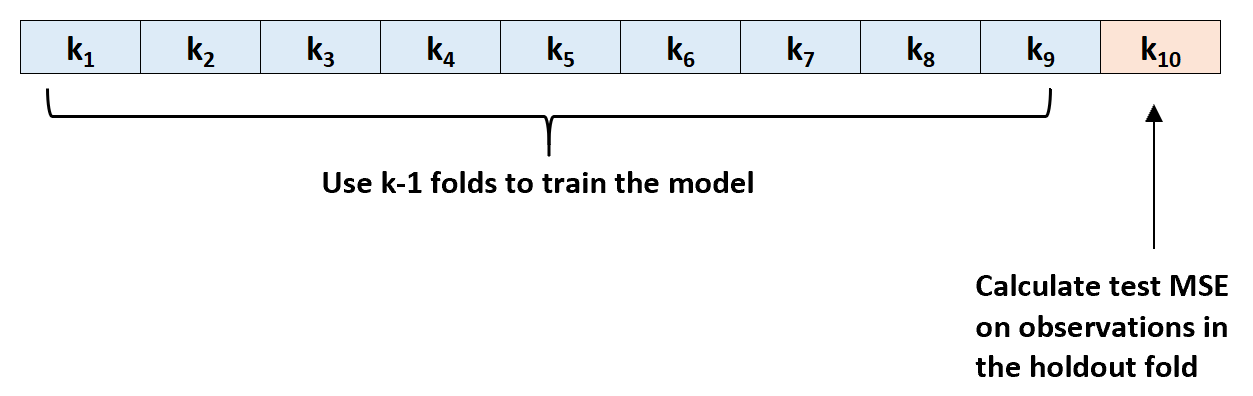
Step 3: Repeat this process k times, using a different set each time as the holdout set.
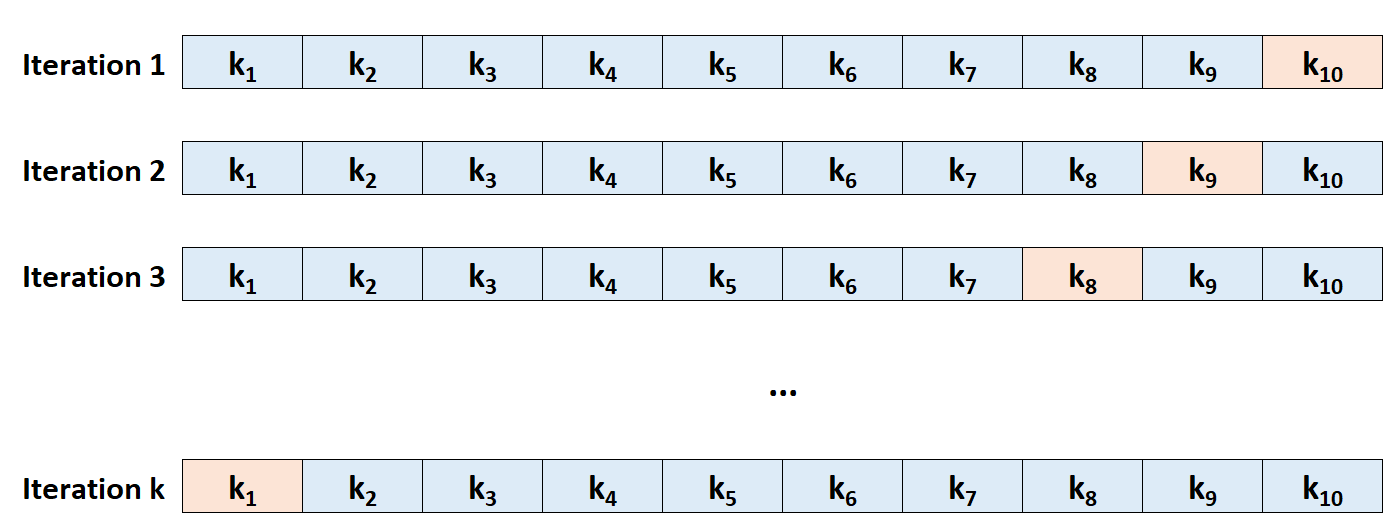
Step 4: Calculate the overall test MSE to be the average of the k test MSE’s.
Test MSE = (1/k)*ΣMSEi
where:
- k: Number of folds
- MSEi: Test MSE on the ith iteration
This test MSE gives us a good idea of how a given model will perform on unseen data.
In practice we can fit several different models and perform k-fold cross-validation on each model to find out its test MSE. Then we can choose the model with the lowest test MSE as the best model to use for making predictions in the future.
This ensures that we select a model that is likely to perform best on future data, as opposed to a model that simply minimizes the training MSE and “fits” historical data well.
Additional Resources
What is the Bias-Variance Tradeoff in Machine Learning?
An Introduction to K-Fold Cross-Validation
Regression vs. Classification Models in Machine Learning