Covariance is a measure of how changes in one variable are associated with changes in a second variable. Specifically, it’s a measure of the degree to which two variables are linearly associated.
The formula to calculate the covariance between two variables, X and Y is:
COV(X, Y) = Σ(x-x)(y-y) / n
A covariance matrix is a square matrix that shows the covariance between different variables in a dataset.
This tutorial explains how to create a covariance matrix for a given dataset in SPSS.
Example: Covariance Matrix in SPSS
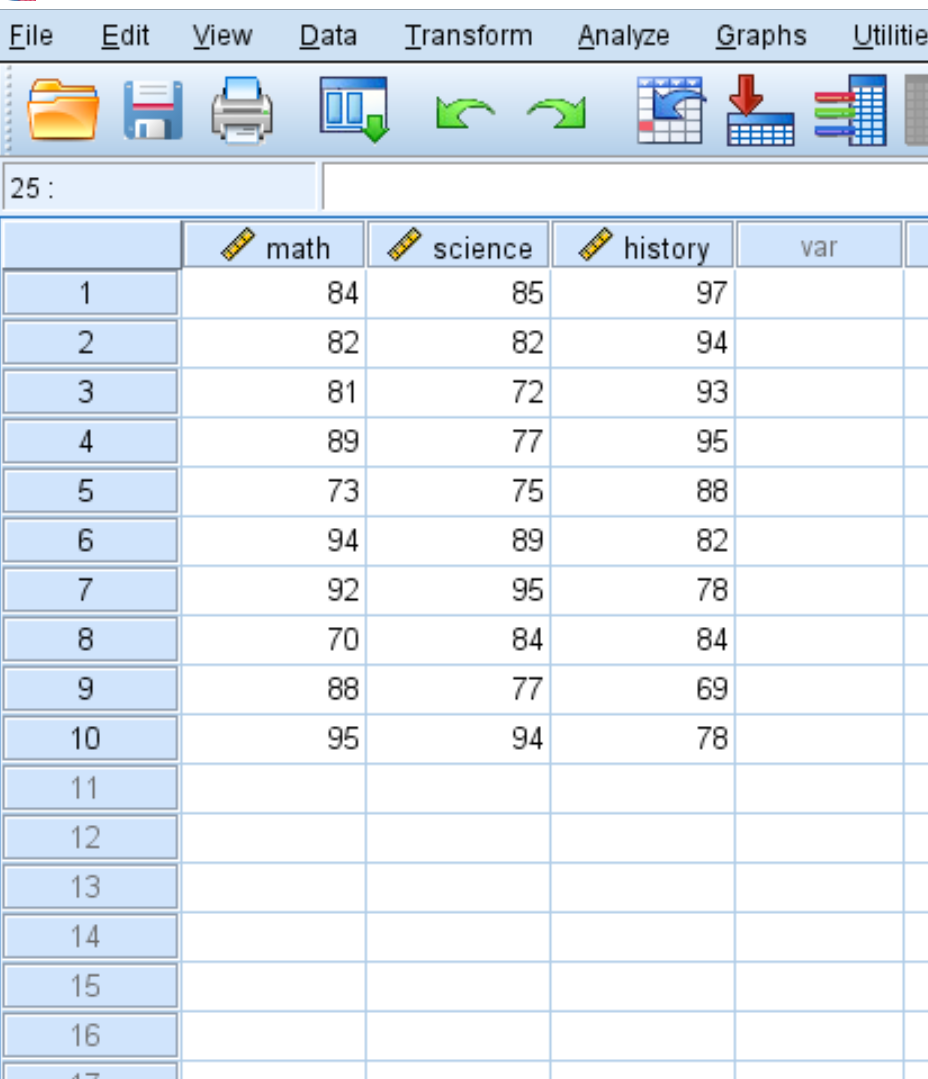
Suppose we have the following dataset that shows the test scores of 10 different students for three subjects: math, science, and history:
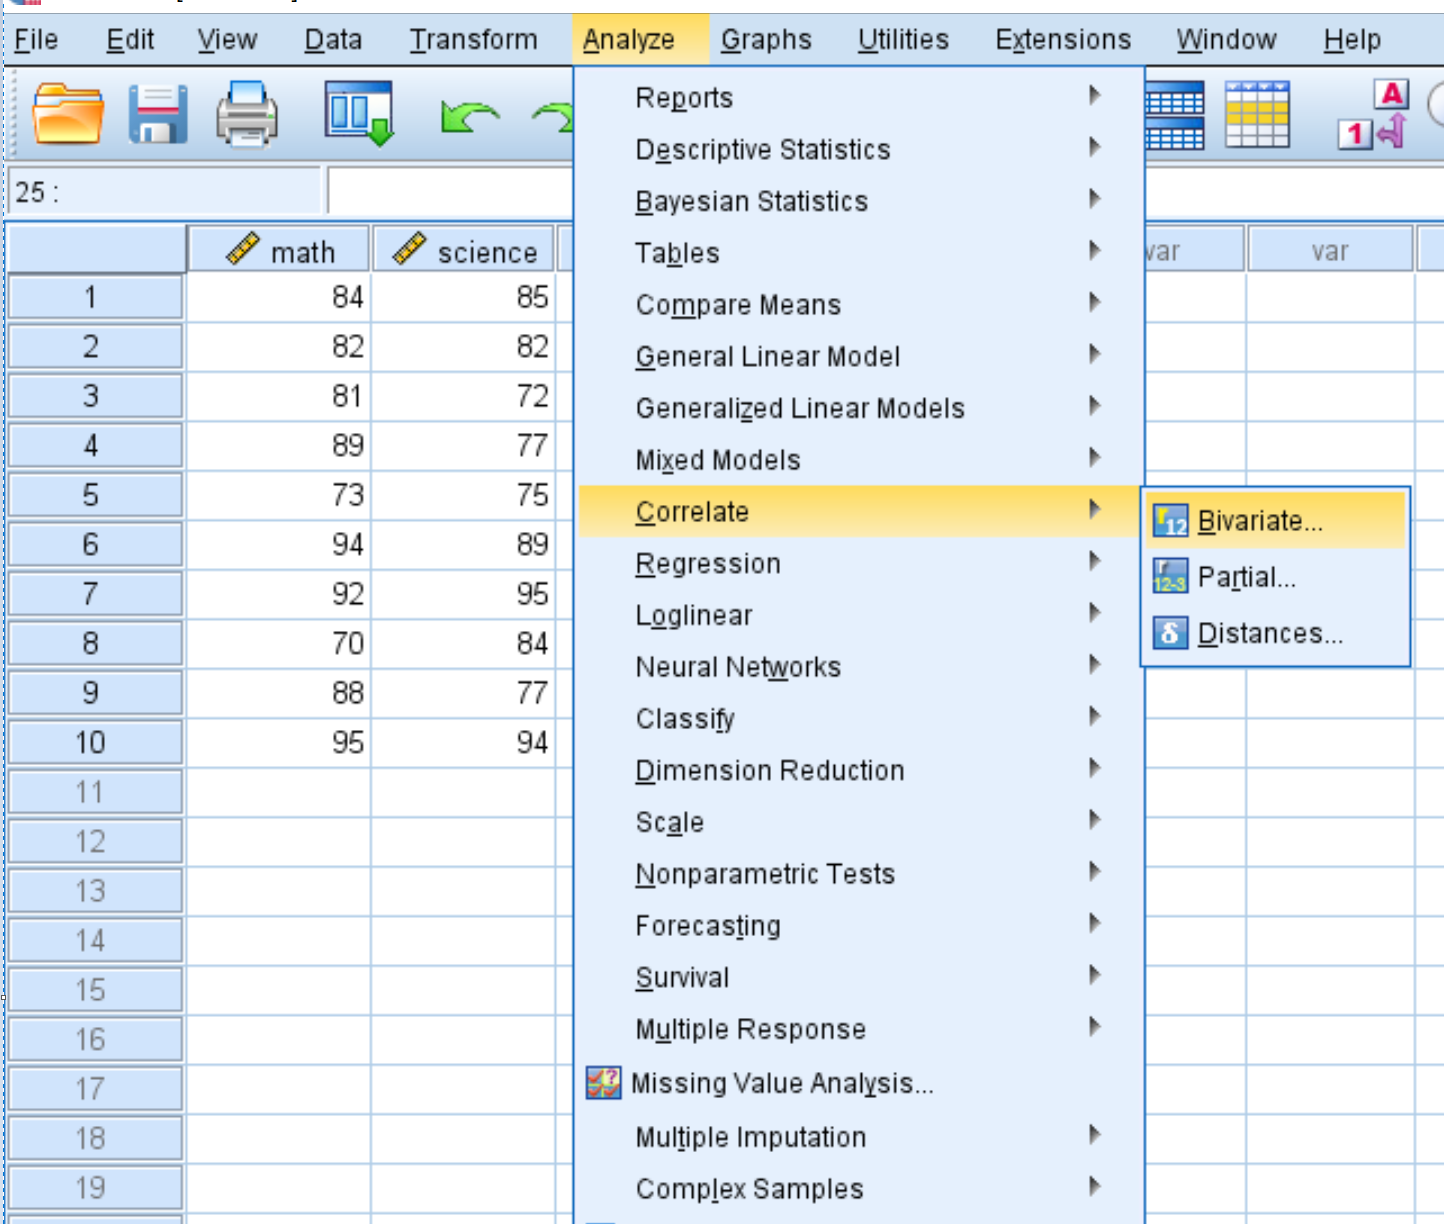
To create a covariance matrix for this dataset, click the Analyze tab, then Correlate, then Bivariate:
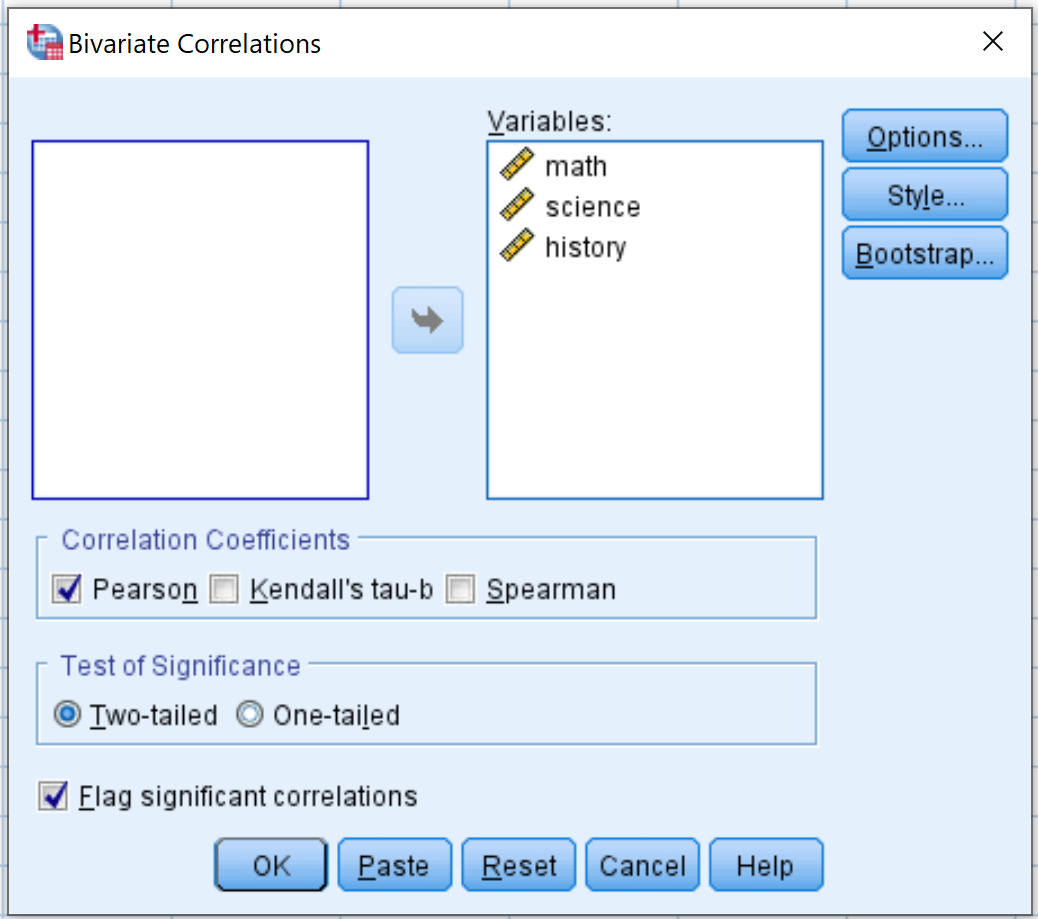
In the new window that pops up, drag each of the three variables into the box labelled Variables:
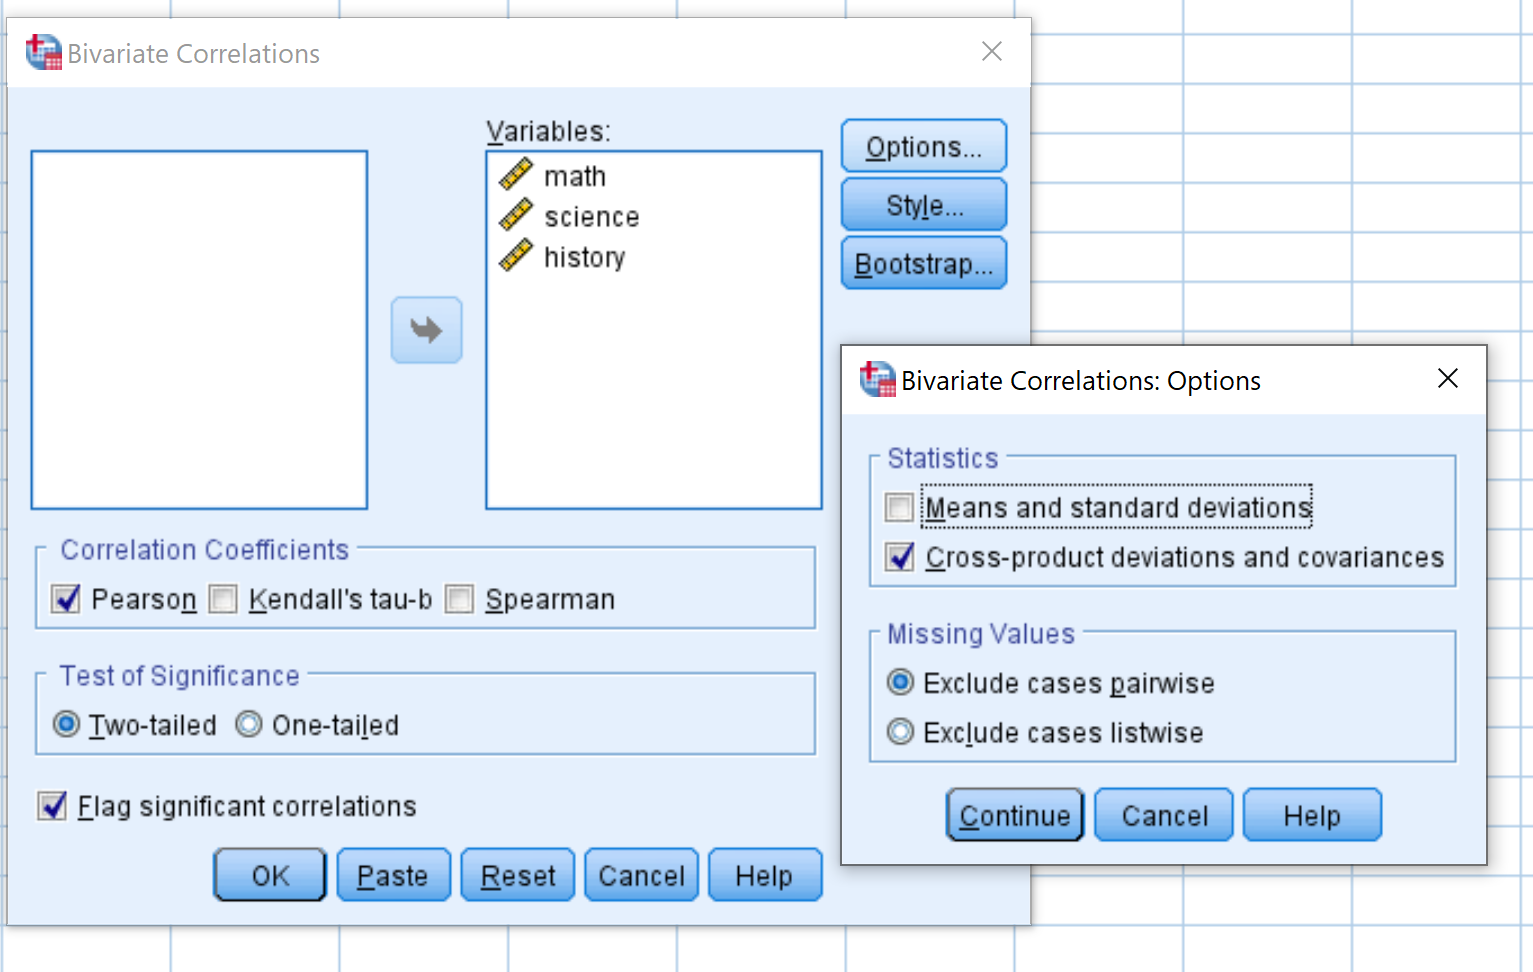
Next, click Options. Check the box next to Cross-product deviations and covariances. Then click Continue.
Then click OK. The output will appear in a new window:
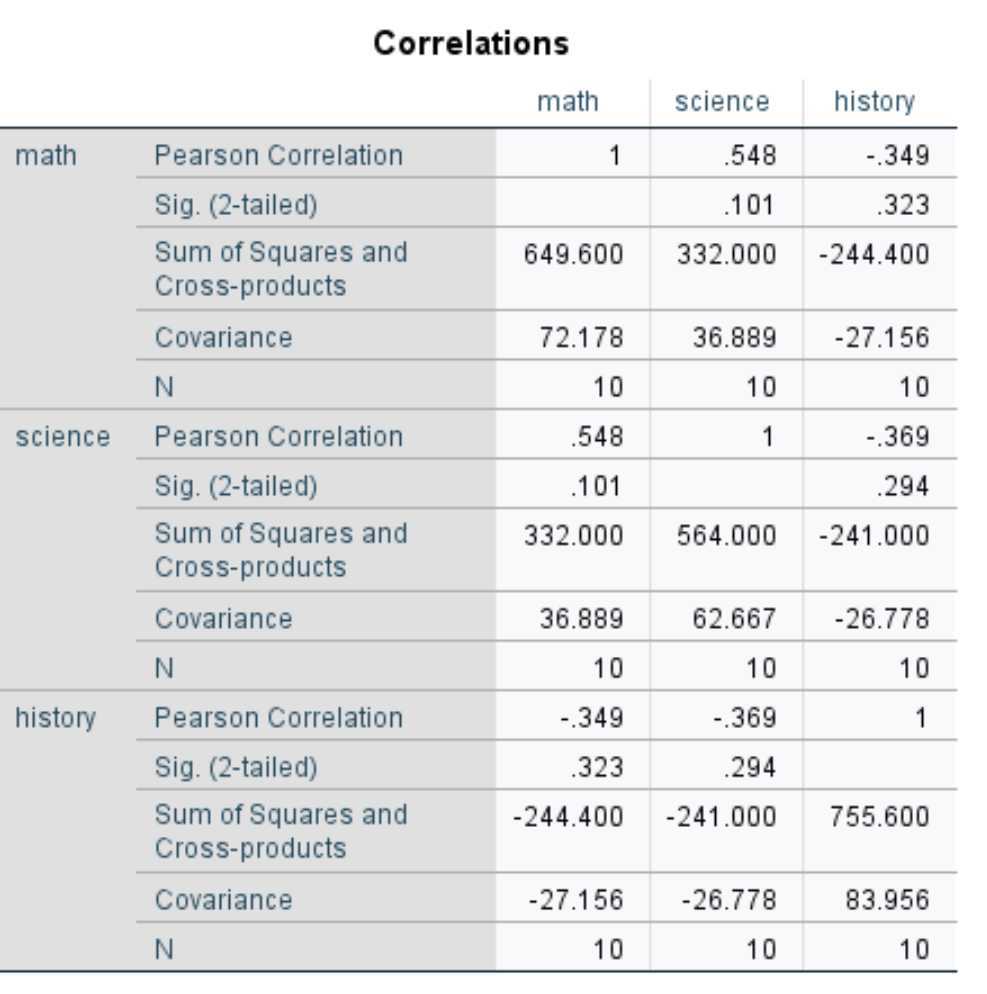
To obtain the covariance for each pairwise combination of variables, you must divide the Sum of Squares and Cross-products by N.
For example, the covariance between math and science can be calculated as:
COV(math, science) = 332.000 / 10 = 33.2.
Similarly, the covariance between math and history can be calculated as:
COV(math, history) = -244.400 / 10 = -24.44.
You can also obtain the variance for each variable by dividing the Sum of Squares and Cross-products by N.
For example, the variance for math can be calculated as:
VAR(math) = 649.600 / 10 = 64.96.
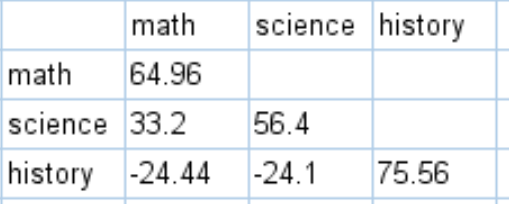
You can obtain the entire covariance matrix for this dataset by performing similar calculations:
How to Interpret a Covariance Matrix
The values along the diagonals of the covariance matrix are simply the variances of each subject. For example:
- The variance of the math scores is 64.96.
- The variance of the science scores is 56.4.
- The variance of the history scores is 75.56.
The other values in the matrix represent the covariances between the various subjects. For example:
- The covariance between the math and science scores is 33.2.
- The covariance between the math and history scores is -24.44.
- The covariance between the science and history scores is -24.1.
A positive number for covariance indicates that two variables tend to increase or decrease in tandem. For example, math and science have a positive covariance (33.2), which indicates that students who score high on math also tend to score high on science. Likewise, students who score low on math also tend to score low on science.
A negative number for covariance indicates that as one variable increases, a second variable tends to decrease. For example, science and history have a negative covariance (-24.1), which indicates that students who score high on science tend to score low on history. Likewise, students who score low on science tend to score high on history.
Additional Resources
How to Create a Correlation Matrix in SPSS
How to Calculate Partial Correlation in SPSS