This tutorial explains how to identify the F-statistic in the output of a regression table as well as how to interpret this statistic and its corresponding p-value.
Understanding the F-Test of Overall Significance
The F-Test of overall significance in regression is a test of whether or not your linear regression model provides a better fit to a dataset than a model with no predictor variables.
The F-Test of overall significance has the following two hypotheses:
Null hypothesis (H0) : The model with no predictor variables (also known as an intercept-only model) fits the data as well as your regression model.
Alternative hypothesis (HA) : Your regression model fits the data better than the intercept-only model.
When you fit a regression model to a dataset, you will receive a regression table as output, which will tell you the F-statistic along with the corresponding p-value for that F-statistic.
If the p-value is less than the significance level you’ve chosen (common choices are .01, .05, and .10), then you have sufficient evidence to conclude that your regression model fits the data better than the intercept-only model.
Example: F-Test in Regression
Suppose we have the following dataset that shows the total number of hours studied, total prep exams taken, and final exam score received for 12 different students:
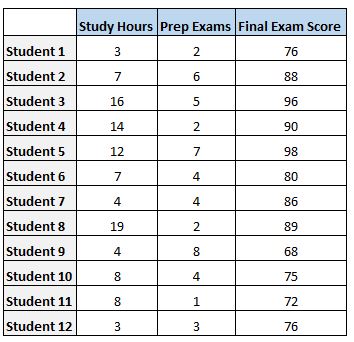
To analyze the relationship between hours studied and prep exams taken with the final exam score that a student receives, we run a multiple linear regression using hours studied and prep exams taken as the predictor variables and final exam score as the response variable.
We receive the following output:
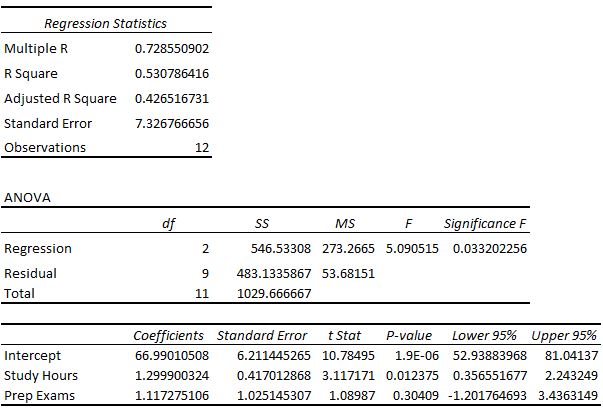
From these results, we will focus on the F-statistic given in the ANOVA table as well as the p-value of that F-statistic, which is labeled as Significance F in the table. We will choose .05 as our significance level.
F-statistic: 5.090515
P-value: 0.0332
Technical note: The F-statistic is calculated as MS regression divided by MS residual. In this case MS regression / MS residual =273.2665 / 53.68151 = 5.090515.
Since the p-value is less than the significance level, we can conclude that our regression model fits the data better than the intercept-only model.
In the context of this specific problem, it means that using our predictor variables Study Hours and Prep Exams in the model allows us to fit the data better than if we left them out and simply used the intercept-only model.
Notes on Interpreting the F-Test of Overall Significance
In general, if none of your predictor variables are statistically significant, the overall F-test will also not be statistically significant.
However, it’s possible on some occasions that this doesn’t hold because the F-test of overall significance tests whether all of the predictor variables are jointly significant while the t-test of significance for each individual predictor variable merely tests whether each predictor variable is individually significant.
Thus, the F-test determines whether or not all of the predictor variables are jointly significant.
It’s possible that each predictor variable is not significant and yet the F-test says that all of the predictor variables combined are jointly significant.
Technical note: In general, the more predictor variables you have in the model, the higher the likelihood that the The F-statistic and corresponding p-value will be statistically significant.
Another metric that you’ll likely see in the output of a regression is R-squared, which measures the strength of the linear relationship between the predictor variables and the response variable is another.
Although R-squared can give you an idea of how strongly associated the predictor variables are with the response variable, it doesn’t provide a formal statistical test for this relationship.
This is why the F-Test is useful since it is a formal statistical test. In addition, if the overall F-test is significant, you can conclude that R-squared is not equal to zero and that the correlation between the predictor variable(s) and response variable is statistically significant.
Additional Resources
The following tutorials explain how to interpret other common values in regression models:
How to Read and Interpret a Regression Table
Understanding the Standard Error of the Regression
What is a Good R-squared Value?