One of the most common tests used in statistics is the t-test, which is often used to determine if a population mean is equal to some value.
For example, suppose we want to know if the mean height of a certain species of plant is equal to 15 inches. To test this, we could collect a random sample of 20 plants, find the sample mean and sample standard deviation, and perform a t-test to determine if the mean height is actually equal to 15 inches.
The null and alternative hypothesis for the test are as follows:
H0: µ = 15
Ha: µ ≠ 15
The formula for the test statistic is:
t = (x-μ) / (s/√n)
where x is the sample mean, μ is the hypothesized mean (in our example it would be 15), s is the sample standard deviation, and n is the sample size.
Once we know the value of t, we can use statistical software or an online calculator to find the corresponding p-value. If the p-value is less than some alpha level (common choices are .01, .05, and .10) then we can reject the null hypothesis and conclude that the mean height of the plants is not equal to 15 inches.
However, it’s also possible to estimate the p-value of the test by hand using a t-Distribution table. In this post, we’ll explain how to do so.
Example: Calculating the p-value from a t-test by hand
Problem: Bob wants to know if the mean height of a certain species of plant is equal to 15 inches. To test this, he collects a random sample of 20 plants and finds that the sample mean is 14 inches and the sample standard deviation is 3 inches. Conduct a t-test using a .05 alpha level to determine if the true mean height for the population is actually 15 inches.
Solution:
Step 1: State the null and alternative hypotheses.
H0: µ = 15
Ha: µ ≠ 15
Step 2: Find the test statistic.
t = (x-μ) / (s/√n) = (14-15) / (3/√20) = -1.49
Step 3: Find the p-value for the test statistic.
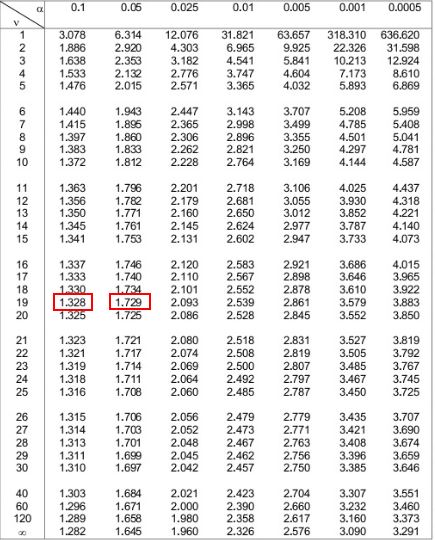
To find the p-value by hand, we need to use the t-Distribution table with n-1 degrees of freedom. In our example, our sample size is n = 20, so n-1 = 19.
In the t-Distribution table below, we need to look at the row that corresponds to “19” on the left-hand side and attempt to look for the absolute value of our test statistic 1.49.
Notice that 1.49 does not show up in the table, but it does fall between the two values 1.328 and 1.729.
Next, we can look at the two alpha levels at the top of the table that correspond to these two numbers. We see that they are 0.1 and 0.5.
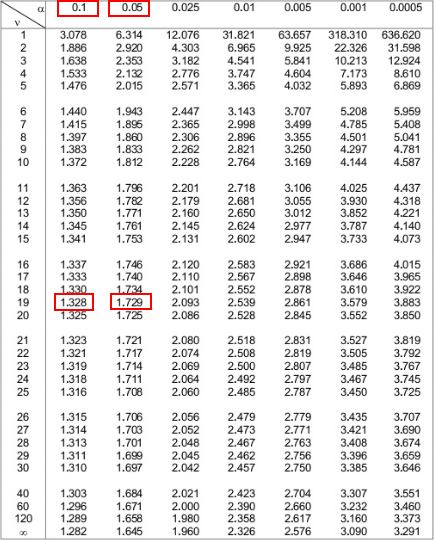
This means that the p-value for a one-sided test is between 0.1 and 0.05. Let’s call it .075. Since our t-test is two-sided, we need to multiply this value by 2. So, our estimated p-value is .075 * 2 = 0.15.
Step 4: Draw a conclusion.
Since this p-value is not less than our chosen alpha level of .05, we can’t reject the null hypothesis. Thus, we don’t have sufficient evidence to say that the true mean height of this species of plant is different than 15 inches.
Verifying the Results with a Calculator
We can plug our test statistic t and our degrees of freedom into an online p-value calculator to see how close our estimated p-value was to the true p-value:
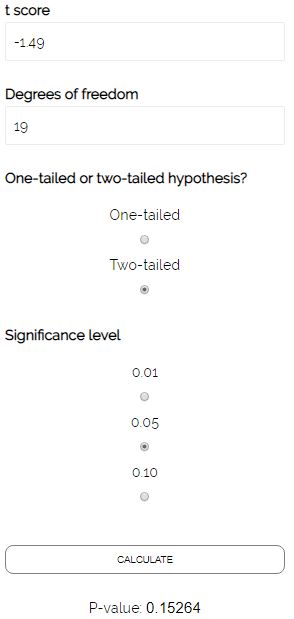
The true p-value is 0.15264, which is pretty close to our estimated p-value of 0.15.
Conclusion
We saw in this post that it’s possible to estimate the p-value of a t-test by hand using the t-Distribution table. However, in most scenarios you will never have to calculate the p-value by hand and instead you can use either statistical software like R and Excel, or an online calculator to find the exact p-value of the test.
In most cases, especially in rigorous statistical studies and experiments, you will want to use a calculator to find the exact p-value from a t-test so that you can be as accurate as possible, but it’s good to know that you can still estimate the p-value from a t-test by hand if you absolutely need to.