Spline regression is a type of regression that is used when there are points or “knots” where the pattern in the data abruptly changes and linear regression and polynomial regression aren’t flexible enough to fit the data.
The following step-by-step example shows how to perform spline regression in R.
Step 1: Create the Data
First, let’s create a dataset in R with two variables and create a scatterplot to visualize the relationship between the variables:
#create data frame
df frame(x=1:20,
                 y=c(2, 4, 7, 9, 13, 15, 19, 16, 13, 10,
                     11, 14, 15, 15, 16, 15, 17, 19, 18, 20))

#view head of data frame
head(df)

  x  y
1 1  2
2 2  4
3 3  7
4 4  9
5 5 13
6 6 15

#create scatterplot
plot(df$x, df$y, cex=1.5, pch=19)
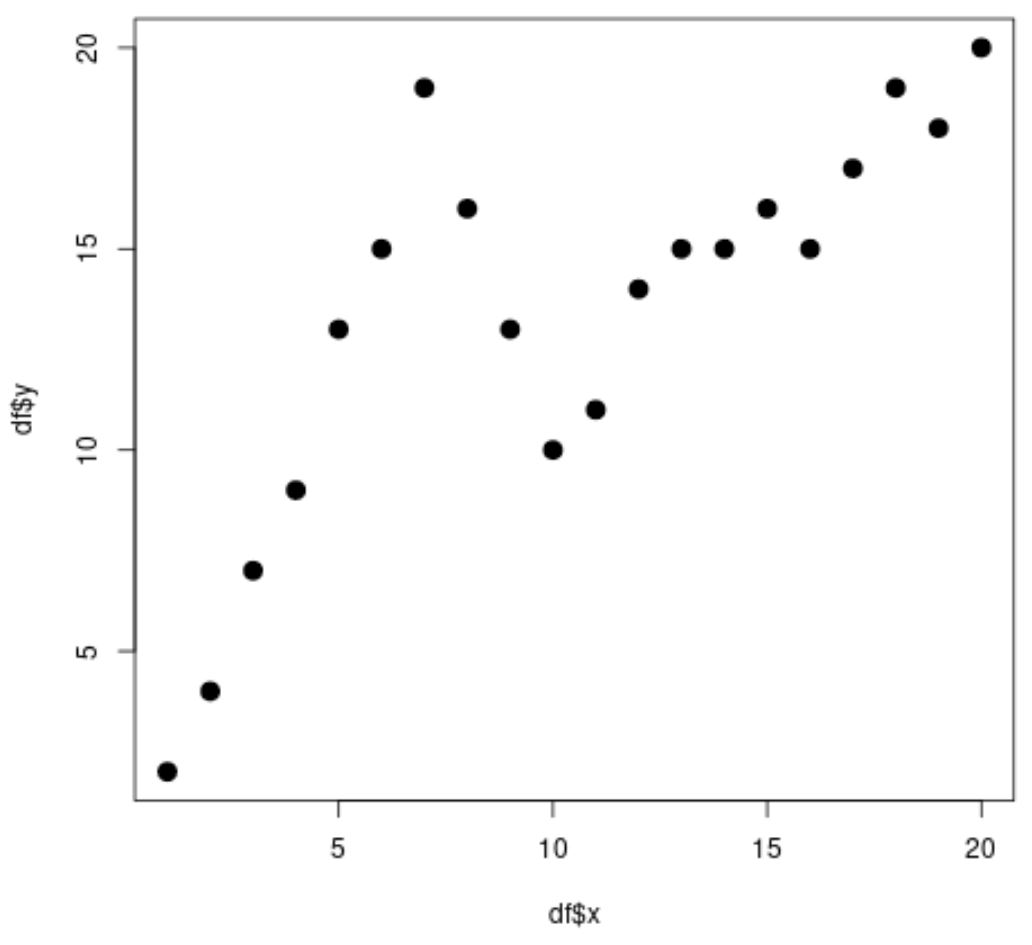
Clearly the relationship between x and y is non-linear and there appear to be two points or “knots” where the pattern in the data abruptly changes at x = 7 and x = 10.
Step 2: Fit Simple Linear Regression Model
Next, let’s use the lm() function to fit a simple linear regression model to this dataset and plot the fitted regression line on the scatterplot:
#fit simple linear regression model
linear_fit #view model summary
summary(linear_fit)

Call:
lm(formula = df$y ~ df$x)

Residuals:
    Min      1Q  Median      3Q     Max
-5.2143 -1.6327 -0.3534  0.6117  7.8789

Coefficients:
            Estimate Std. Error t value Pr(>|t|)
(Intercept)   6.5632     1.4643   4.482 0.000288 ***
df$x          0.6511     0.1222   5.327  4.6e-05 ***
---
Signif. codes:  0 '***' 0.001 '**' 0.01 '*' 0.05 '.' 0.1 ' ' 1

Residual standard error: 3.152 on 18 degrees of freedom
Multiple R-squared:  0.6118,	Adjusted R-squared:  0.5903
F-statistic: 28.37 on 1 and 18 DF,  p-value: 4.603e-05

#create scatterplot
plot(df$x, df$y, cex=1.5, pch=19)

#add regression line to scatterplot
abline(linear_fit)
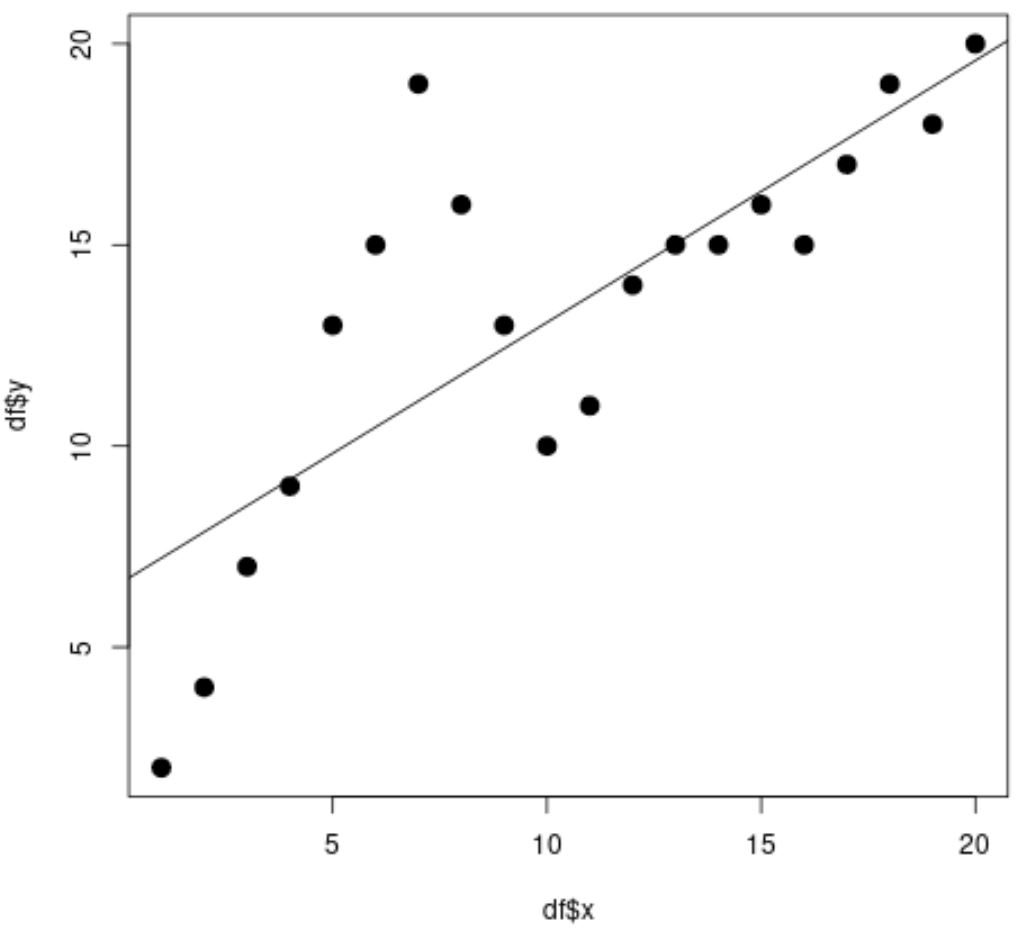
From the scatterplot we can see that the simple linear regression line doesn’t fit the data well.
From the model output we can also see that the adjusted R-squared value is 0.5903.
We’ll compare this to the adjusted R-squared value of a spline model.
Step 3: Fit Spline Regression Model
Next, let’s use the bs() function from the splines package to fit a spline regression model with two knots and then plot the fitted model on the scatterplot:
library(splines)

#fit spline regression model
spline_fit 7, 10)))

#view summary of spline regression model
summary(spline_fit)

Call:
lm(formula = df$y ~ bs(df$x, knots = c(7, 10)))

Residuals:
     Min       1Q   Median       3Q      Max
-2.84883 -0.94928  0.08675  0.78069  2.61073

Coefficients:
                            Estimate Std. Error t value Pr(>|t|)
(Intercept)                    2.073      1.451   1.429    0.175
bs(df$x, knots = c(7, 10))1    2.173      3.247   0.669    0.514
bs(df$x, knots = c(7, 10))2   19.737      2.205   8.949 3.63e-07 ***
bs(df$x, knots = c(7, 10))3    3.256      2.861   1.138    0.274
bs(df$x, knots = c(7, 10))4   19.157      2.690   7.121 5.16e-06 ***
bs(df$x, knots = c(7, 10))5   16.771      1.999   8.391 7.83e-07 ***
---
Signif. codes:  0 '***' 0.001 '**' 0.01 '*' 0.05 '.' 0.1 ' ' 1

Residual standard error: 1.568 on 14 degrees of freedom
Multiple R-squared:  0.9253,	Adjusted R-squared:  0.8987
F-statistic:  34.7 on 5 and 14 DF,  p-value: 2.081e-07

#calculate predictions using spline regression model
x_lim 1], x_lim[2])
preds #create scatter plot with spline regression predictions
plot(df$x, df$y, cex=1.5, pch=19)
lines(x_grid, preds)
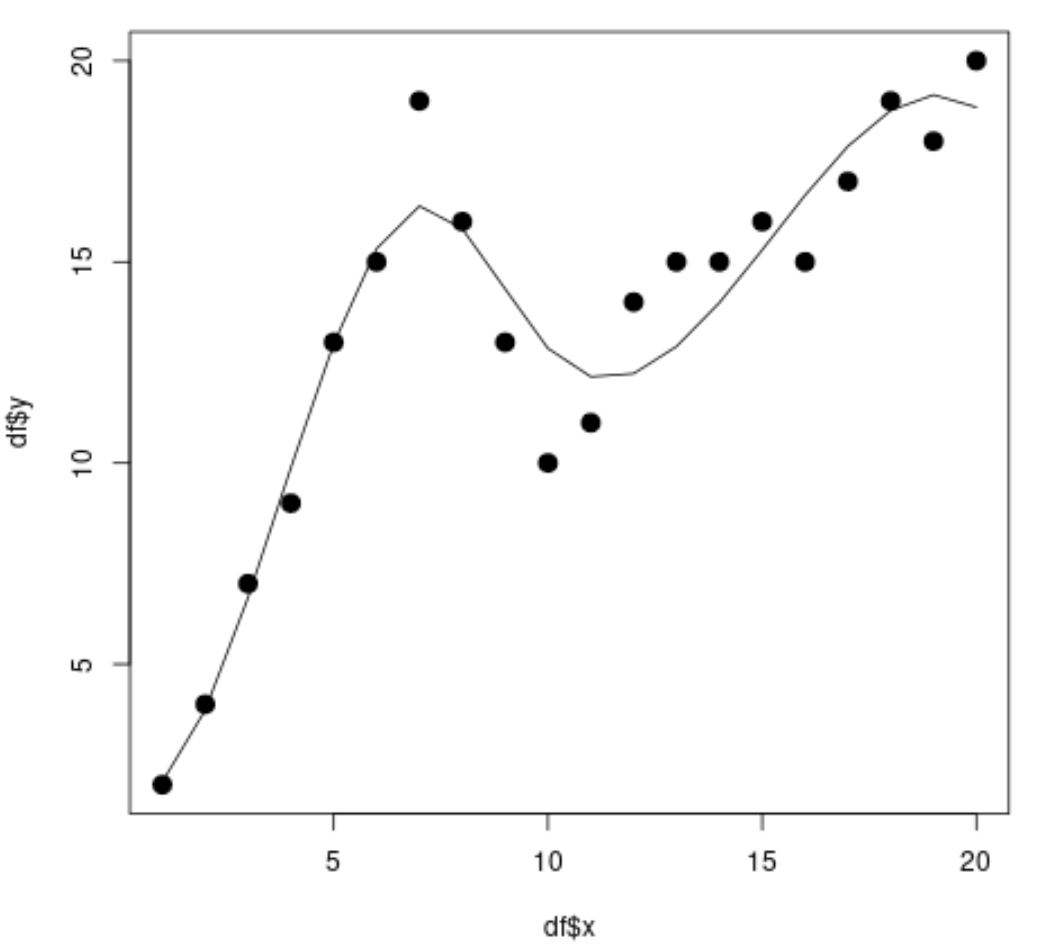
From the scatterplot we can see that the spline regression model is able to fit the data quite well.
From the model output we can also see that the adjusted R-squared value is 0.8987.
The adjusted R-squared value for this model is much higher than the simple linear regression model, which tells us that the spline regression model is able to fit the data much better.
Note that for this example we chose the knots to be located at x=7 and x=10.
In practice, you’ll have to pick the knot locations yourself based on where the patterns in the data appear to change and based on domain expertise.
Additional Resources
The following tutorials explain how to perform other common tasks in R:
How to Perform Multiple Linear Regression in R
How to Perform Exponential Regression in R
How to Perform Weighted Least Squares Regression in R