The Friedman Test is a non-parametric alternative to the Repeated Measures ANOVA. It is used to determine whether or not there is a statistically significant difference between the means of three or more groups in which the same subjects show up in each group.
This tutorial explains how to perform the Friedman Test in Stata.
Example: The Friedman Test in Stata
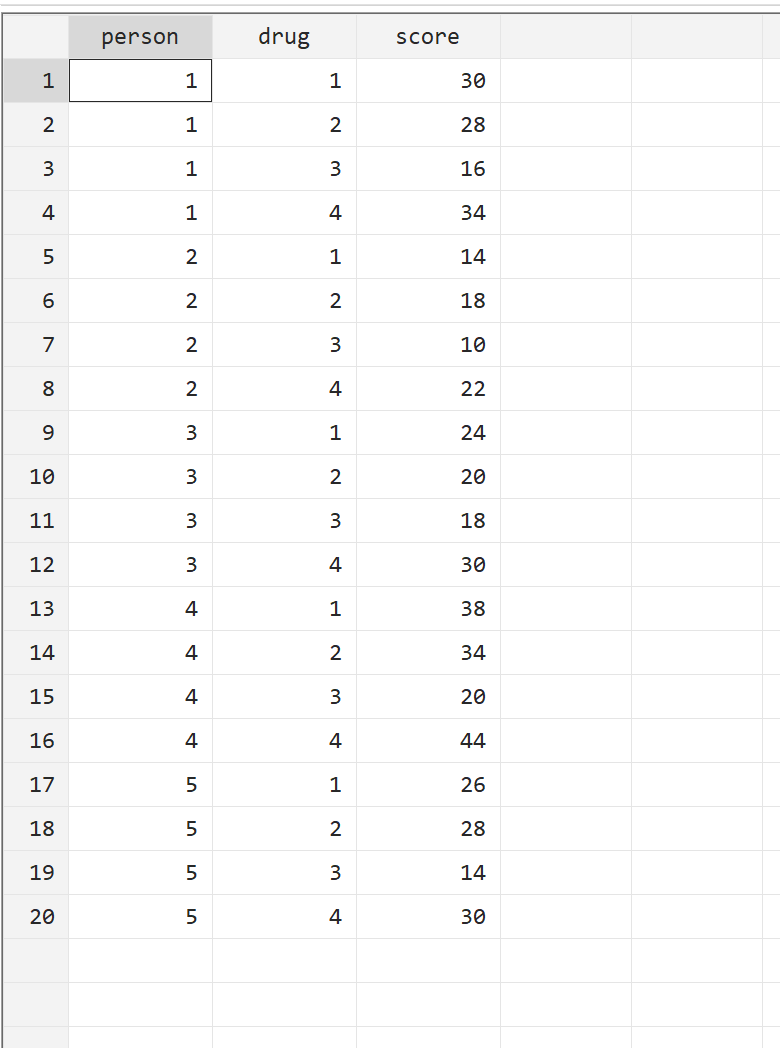
For this example we will use the t43 dataset, which shows the reaction time of five patients on four different drugs. Since each patient is measured on each of the four drugs, we will use the Friedman Test to determine if the mean reaction time differs between drugs.
Use the following steps to perform the Friedman Test:
Step 1: Load and view the data.
Use the following command to load the data in Stata:
use http://www.stata-press.com/data/r14/t43
View the raw data using the following command:
br
Step 2: Install the emh package.
To perform the Friedman Test, we will need to install the emh package, which doesn’t come pre-installed in Stata. To install it, simply type in the following command:
ssc install emh
It should install automatically within a few seconds.
Step 3: Perform the Friedman Test.
Once the emh package is installed, we can perform the Friedman Test by using the following syntax:
emh response_variable explanatory_variable, strata(repeated variable) anova transformation(rank)
In our case, we will use the following syntax:
emh score drug, strata(person) anova transformation(rank)
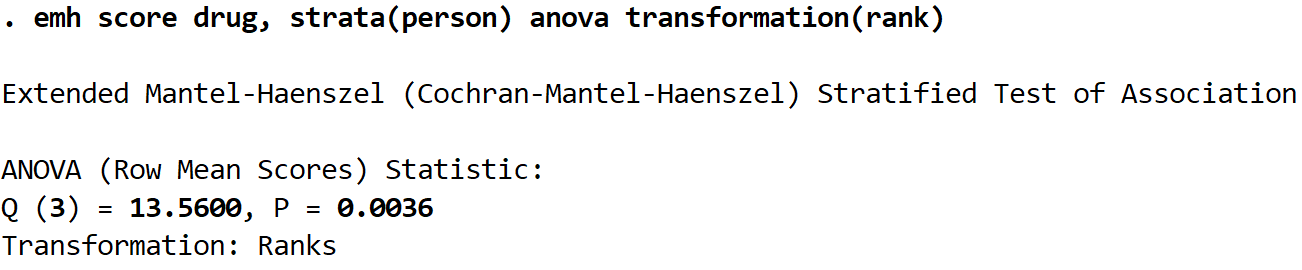
Here is how to interpret the output:
Q (3) = 13.5600. This is the test statistic of the Friedman Test.
P = 0.0036. This is the p-value associated with the test statistic. Since this value is less than 0.05, we can reject the null hypothesis that the mean response time is the same for all four drugs. We have sufficient evidence to conclude that the type of drug used lead to statistically significant differences in response time.
Step 4: Report the results.
Lastly, we want to report the results of the test. Here is an example of how to do so:
A Friedman Test was conducted on 5 individuals to examine the effect that four different drugs had on response time. Each individual used each drug once.
Results showed that the type of drug used lead to statistically significant differences in response time (Q(3) = 13.56, p = 0.0036).