This tutorial explains how to read and interpret the t-Distribution table.
What is the t-Distribution Table?
The t-distribution table is a table that shows the critical values of the t distribution. To use the t-distribution table, you only need to know three values:
- The degrees of freedom of the t-test
- The number of tails of the t-test (one-tailed or two-tailed)
- The alpha level of the t-test (common choices are 0.01, 0.05, and 0.10)
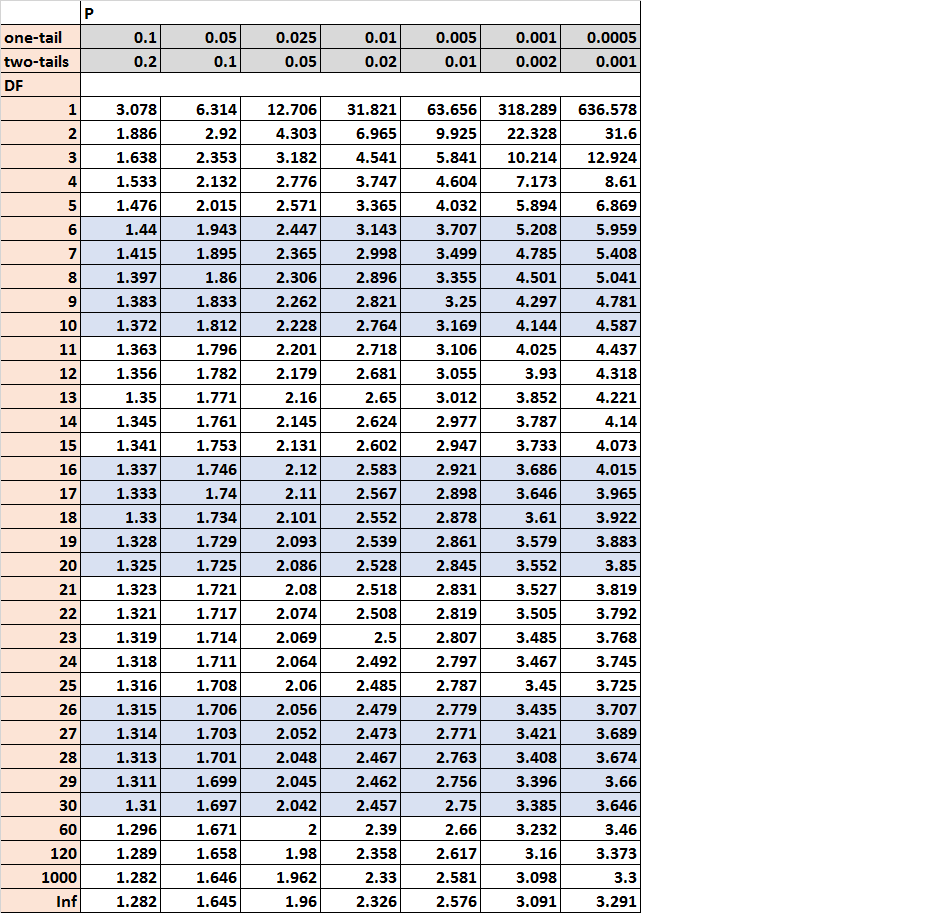
Here is an example of the t-Distribution table, with the degrees of freedom listed along the left side of the table and the alpha levels listed along the top of the table:
When you conduct a t-test, you can compare the test statistic from the t-test to the critical value from the t-Distribution table. If the test statistic is greater than the critical value found in the table, then you can reject the null hypothesis of the t-test and conclude that the results of the test are statistically significant.
Let’s walk through some examples of how to use the t-Distribution table.
Examples of How to Use the t-Distribution Table
The following examples explain how to use the t-Distribution table in several different scenarios.
Example #1: One-tailed t-test for a mean
A researcher recruits 20 subjects for a study and conducts a one-tailed t-test for a mean using an alpha level of 0.05.
Question: Once she conducts her one-tailed t-test and obtains a test statistic t, what critical value should she compare t to?
Answer: For a t-test with one sample, the degrees of freedom is equal to n-1, which is 20-1 = 19 in this case. The problem also tells us that she is conducting a one-tailed test and that she is using an alpha level of 0.05, so the corresponding critical value in the t-distribution table is 1.729.
Example #2: Two-tailed t-test for a mean
A researcher recruits 18 subjects for a study and conducts a two-tailed t-test for a mean using an alpha level of 0.10.
Question: Once she conducts her two-tailed t-test and obtains a test statistic t, what critical value should she compare t to?
Answer: For a t-test with one sample, the degrees of freedom is equal to n-1, which is 18-1 = 17 in this case. The problem also tells us that she is conducting a two-tailed test and that she is using an alpha level of 0.10, so the corresponding critical value in the t-distribution table is 1.74.
Example #3: Determining the critical value
A researcher conducts a two-tailed t-test for a mean using a sample size of 14 and an alpha level of 0.05.
Question: What would the absolute value of her test statistic t need to be in order for her to reject the null hypothesis?
Answer: For a t-test with one sample, the degrees of freedom is equal to n-1, which is 14-1 = 13 in this case. The problem also tells us that she is conducting a two-tailed test and that she is using an alpha level of 0.05, so the corresponding critical value in the t-distribution table is 2.16. This means that she can reject the null hypothesis if the test statistic t is less than -2.16 or greater than 2.16.
Example #4: Comparing a critical value to a test statistic
A researcher conducts a right-tailed t-test for a mean using a sample size of 19 and an alpha level of 0.10.
Question: The test statistic t turns out to be 1.48. Can she reject the null hypothesis?
Answer: For a t-test with one sample, the degrees of freedom is equal to n-1, which is 19-1 = 18 in this case. The problem also tells us that she is conducting a right-tailed test (which is a one-tailed test) and that she is using an alpha level of 0.10, so the corresponding critical value in the t-distribution table is 1.33. Since her test statistic t is greater than 1.33, she can reject the null hypothesis.
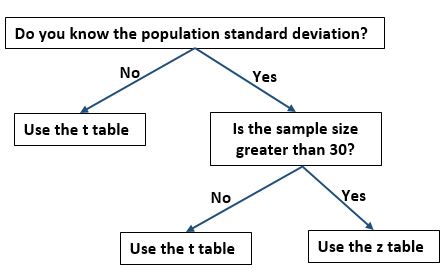
Should You Use the t Table or the z Table?
One problem that students frequently encounter is determining if they should use the t-distribution table or the z table to find the critical values for a particular problem. If you’re stuck on this decision, you can use the following flow chart to determine which table you should use:
Additional Resources
For a complete list of critical value tables, including a binomial distribution table, a chi-square distribution table, a z-table, and more, check out this page.