A Kruskal-Wallis test is used to determine whether or not there is a statistically significant difference between the medians of three or more independent groups.
This test is the nonparametric equivalent of the one-way ANOVA and is typically used when the normality assumption is violated.
The Kruskal-Wallis test does not assume normality in the data and is much less sensitive to outliers than the one-way ANOVA.
Here are a couple examples of when you might conduct a Kruskal-Wallis test:
Example 1: Comparing Study Techinques
You randomly split up a class of 90 students into three groups of 30. Each group uses a different studying technique for one month to prepare for an exam.
At the end of the month, all of the students take the same exam. You want to know whether or not the studying technique has an impact on exam scores.
From previous studies you know that the distributions of exam scores for these three studying techniques are not normally distributed so you conduct a Kruskal-Wallis test to determine if there is a statistically significant difference between the median scores of the three groups.
Example 2: Comparing Sunlight Exposure
You want to know whether or not sunlight impacts the growth of a certain plant, so you plant groups of seeds in four different locations that experience either high sunlight, medium sunlight, low sunlight or no sunlight.
After one month you measure the height of each group of plants. It is known that the distribution of heights for this certain plant is not normally distributed and is prone to outliers.
To determine if sunlight impacts growth, you conduct a Kruskal-Wallis test to determine if there is a statistically significant difference between the median height of the four groups.
Kruskal-Wallis Test Assumptions
Before we can conduct a Kruskal-Wallis test, we need to make sure the following assumptions are met:
1. Ordinal or Continuous Response Variable – the response variable should be an ordinal or continuous variable. An example of an ordinal variable is a survey response question measured on a Likert Scale (e.g. a 5-point scale from “strongly disagree” to “strongly agree”) and an example of a continuous variable is weight (e.g. measured in pounds).
2. Independence – the observations in each group need to be independent of each other. Usually a randomized design will take care of this.
3. Distributions have similar shapes – the distributions in each group need to have a similar shape.
If these assumptions are met, then we can proceed with conducting a Kruskal-Wallis test.
Example of a Kruskal-Wallis Test
A researcher wants to know whether or not three drugs have different effects on knee pain, so he recruits 30 individuals who all experience similar knee pain and randomly splits them up into three groups to receive either Drug 1, Drug 2, or Drug 3.
After one month of taking the drug, the researcher asks each individual to rate their knee pain on a scale of 1 to 100, with 100 indicating the most severe pain.
The ratings for all 30 individuals are shown below:
| Drug 1 | Drug 2 | Drug 3 |
|---|---|---|
| 78 | 71 | 57 |
| 65 | 66 | 88 |
| 63 | 56 | 58 |
| 44 | 40 | 78 |
| 50 | 55 | 65 |
| 78 | 31 | 61 |
| 70 | 45 | 62 |
| 61 | 66 | 44 |
| 50 | 47 | 48 |
| 44 | 42 | 77 |
The researcher wants to know whether or not the three drugs have different effects on knee pain, so he conducts a Kruskal-Wallis Test using a .05 significance level to determine if there is a statistically significant difference between the median knee pain ratings across these three groups.
We can use the following steps to perform the Kruskal-Wallis Test:
Step 1. State the hypotheses.
The null hypothesis (H0): The median knee-pain ratings across the three groups are equal.
The alternative hypothesis: (Ha): At least one of the median knee-pain ratings is different from the others.
Step 2. Perform the Kruskal-Wallis Test.
To conduct a Kruskal-Wallis Test, we can simply enter the values shown above into the Kruskal-Wallis Test Calculator:
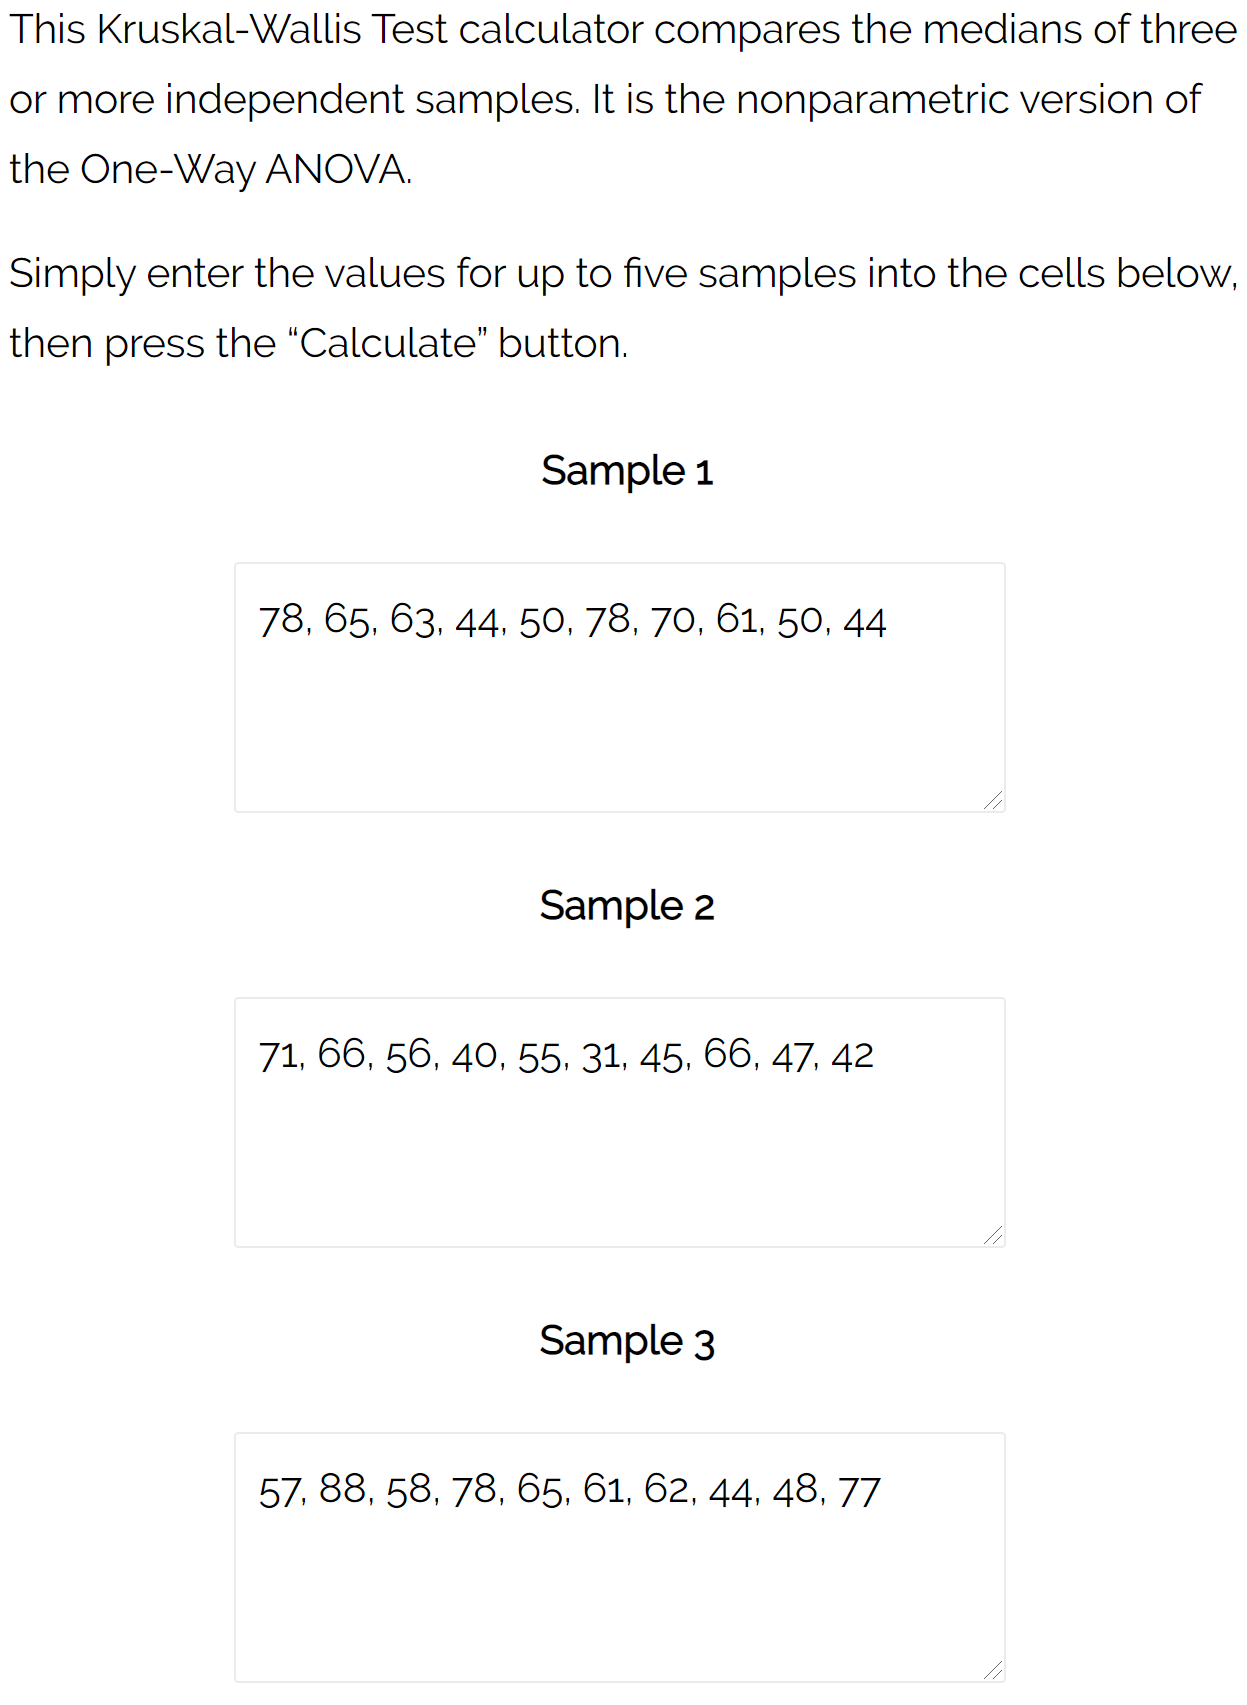
Then click the “Calculate” button:
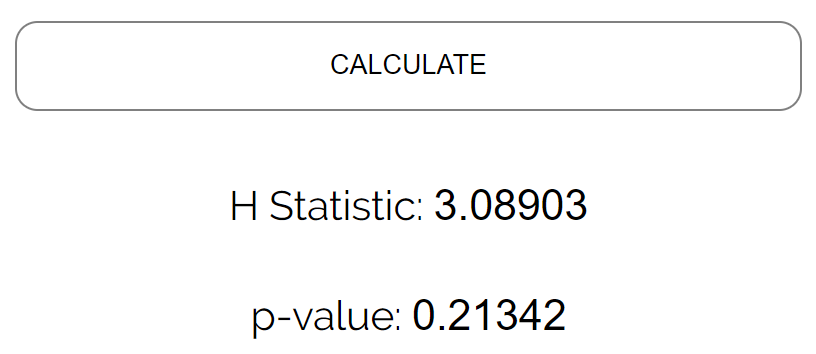
Step 3. Interpret the results.
Since the p-value of the test (0.21342) is not less than 0.05, we fail to reject the null hypothesis.
We do not have sufficient evidence to say that there is a statistically significant difference between the median knee pain ratings across these three groups.
Additional Resources
The following tutorials explain how to perform a Kruskal-Wallis Test using different statistical software:
How to Perform a Kruskal-Wallis Test in Excel
How to Perform a Kruskal-Wallis Test in Python
How to Perform a Kruskal-Wallis Test in SPSS
How to Perform a Kruskal-Wallis Test in Stata
How to Perform a Kruskal-Wallis Test in SAS
Online Kruskal-Wallis Test Calculator