You can use the mtext() function in R to write text in the margins of a plot.
This function uses the following basic syntax:
mtext(text, side=3, line=0, …)
where:
- text: The text to write
- side: The side of the plot to write text on (1=bottom, 2=left, 3=top, 4=right)
- line: The margin line to use (negative values will push text inside plot)
The following examples show how to use the mtext() function in practice with the following data frame in R:
#create data frame
df frame(x=c(1, 2, 3, 4, 5, 6, 7),
                 y=c(3, 4, 4, 8, 6, 10, 14))

#view data frame
df

  x  y
1 1  3
2 2  4
3 3  4
4 4  8
5 5  6
6 6 10
7 7 14
Example 1: Add One Text Element Outside of Plot
The following code shows how to use mtext() to add one text element above the plot:
#create scatterplot
plot(df$x, df$y)

#add text above plot
mtext("Here is some text")
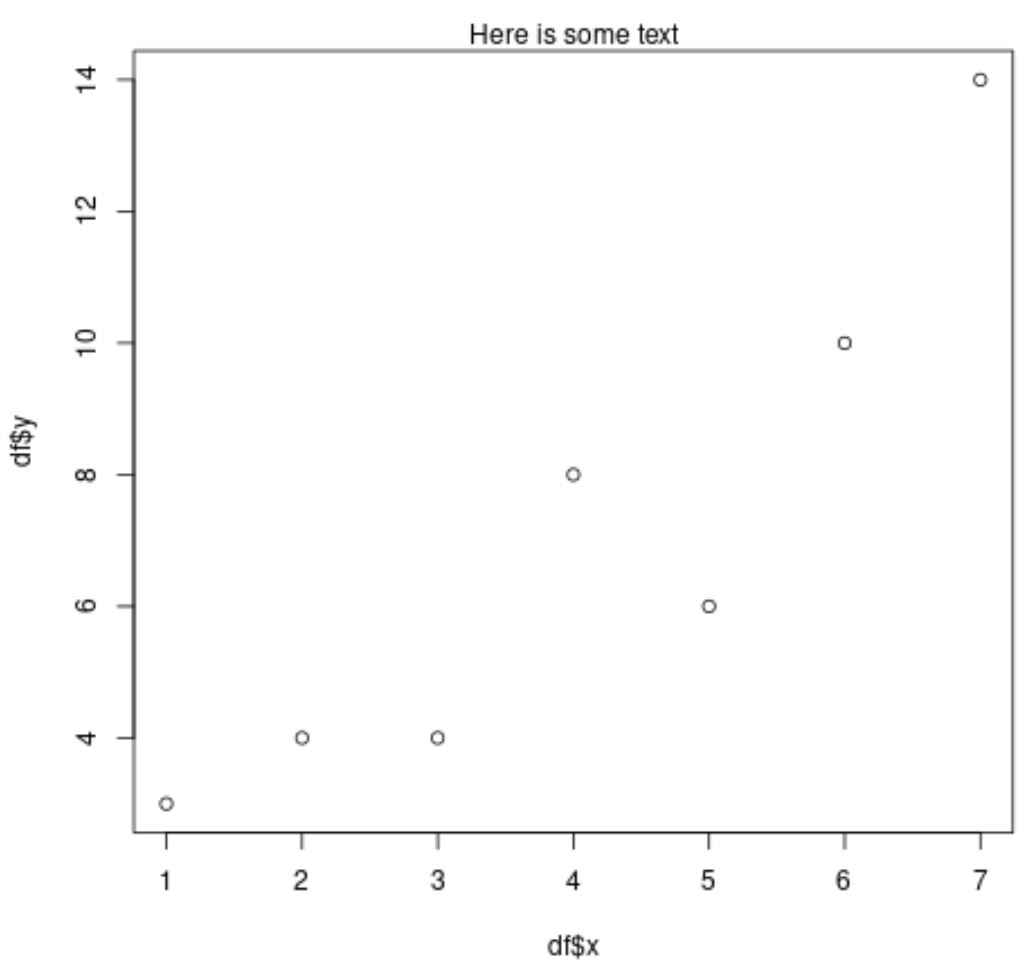
Notice that the text “Here is some text” has been added above the plot.
Example 2: Add Multiple Text Elements Outside of Plot
The following code shows how to use the mtext() function multiple times to add text elements on each side of the plot:
#create scatterplot
plot(df$x, df$y)

#add text on each side of plot
mtext("Text on the bottom", side=1)
mtext("Text on the left", side=2)
mtext("Text on the top", side=3)
mtext("Text on the right", side=4)
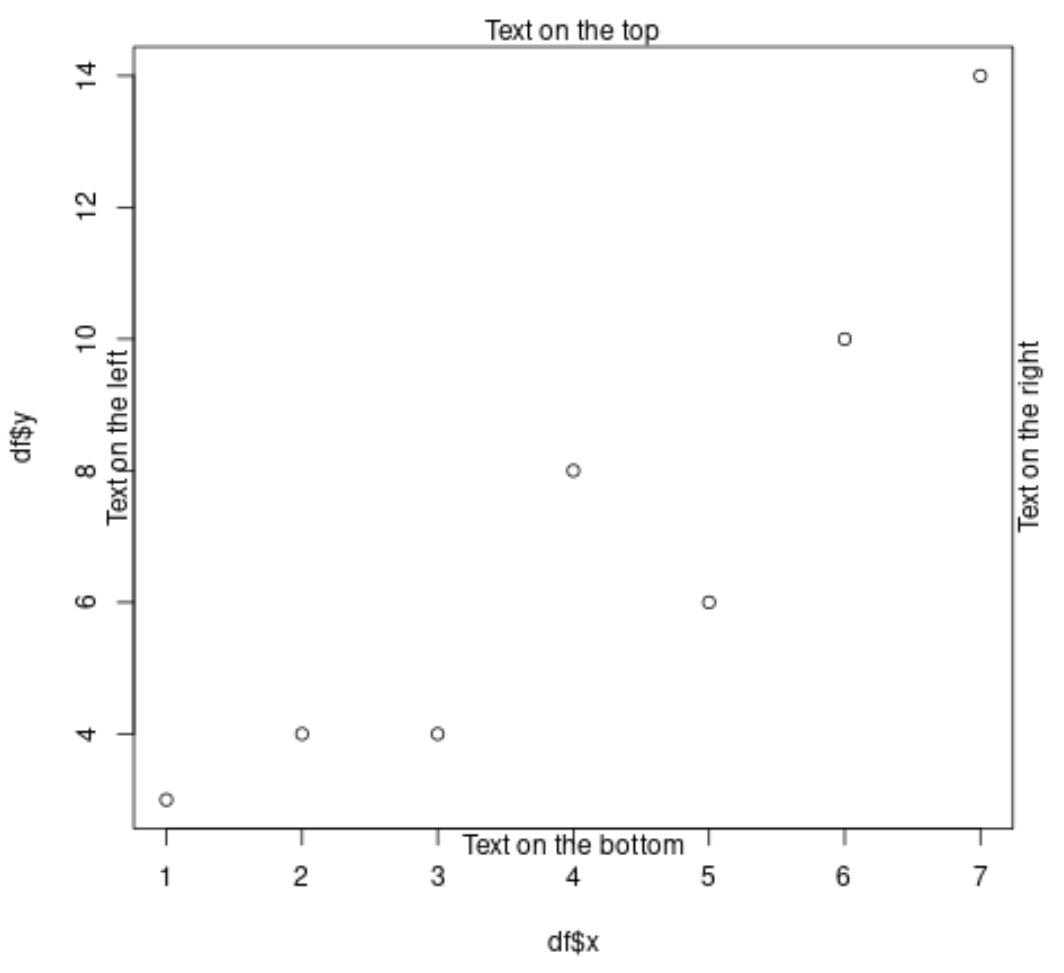
By using the mtext() function multiple times, we’re able to add multiple text elements outside of the plot.
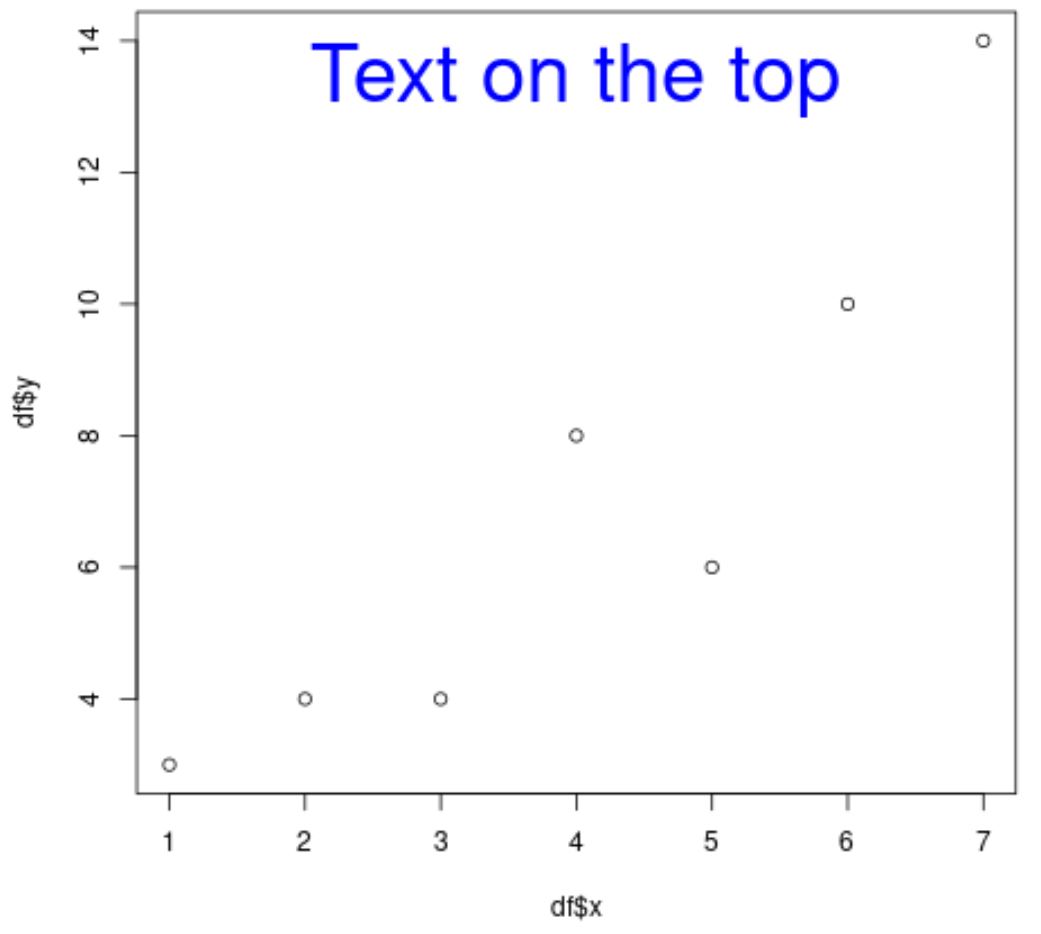
Example 3: Add Customized Text Element Outside of Plot
We can also use the line, cex, and col arguments within mtext() to change the location, size, and color of the text element, respectively.
For example, the following code shows how to add text just inside the top of the plot with an increased font size and a color of blue:
#create scatterplot
plot(df$x, df$y)

#add customized text inside top of plot
mtext("Text on the top", side=3, line=-3, cex=3, col='blue')
Feel free to play around with the various arguments in the mtext() function to generate the exact text you’d like in your plot.
Additional Resources
The following tutorials explain how to use other common functions in R:
How to Draw a Legend Outside of a Plot in R
How to Change Legend Position in Base R Plots
How to Print String and Variable on Same Line in R