Often when you perform statistical tests in SPSS, the output table will contain a Sig. (2-tailed) value.
This value represents the 2-tailed p-value of the test.
If this value is less than your significance level (common choices are .05 or .01), then you can reject the null hypothesis of your test.
This tutorial provides examples of how to interpret the Sig. (2-tailed) value of different statistical tests.
Example 1: One Sample t-test
A one sample t-test is used to test whether or not the mean of a population is equal to some value.
For example, suppose a botanist wants to know if the mean height of a certain species of plant is equal to 15 inches. She collects a random sample of 12 plants and records each of their heights in inches.
She then uses this sample to perform a one sample t-test with the following null and alternative hypotheses:
- H0: μ = 15 (the true population mean is equal to 15 inches)
- HA: μ ≠ 15 (the true population mean is not equal to 15 inches)
She performs this one sample t-test in SPSS and gets the following results:
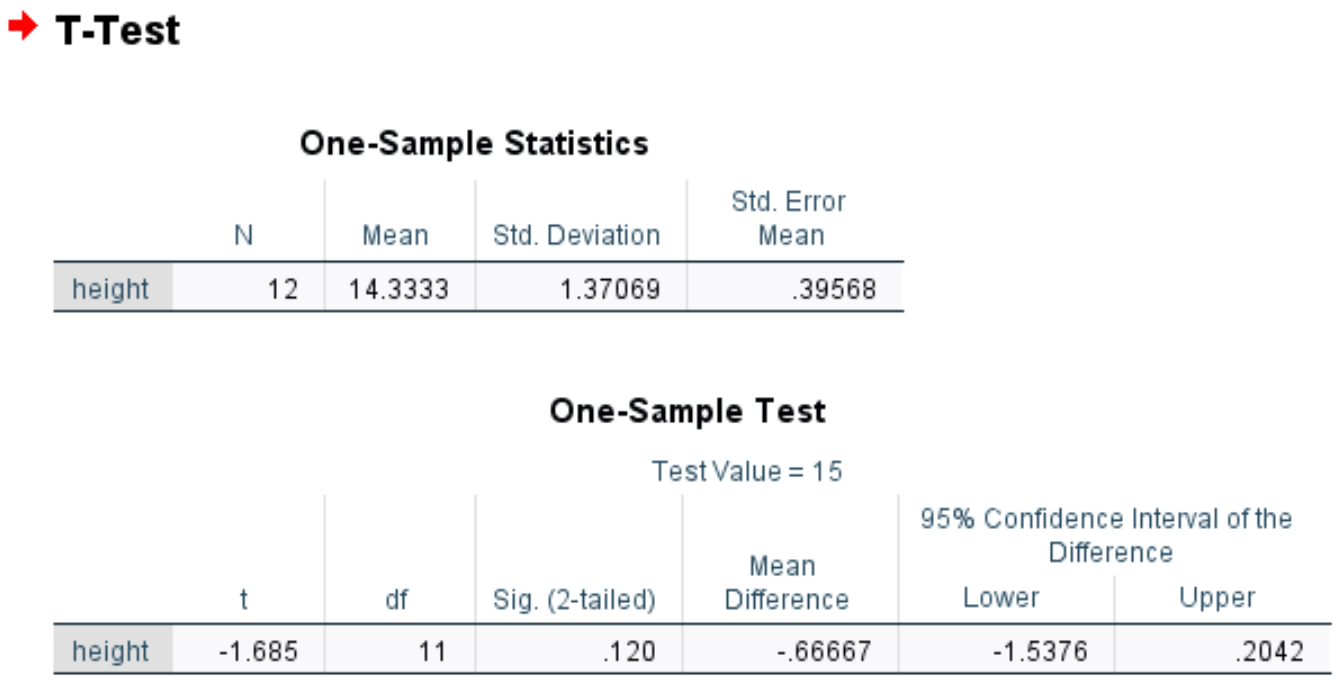
The Sig. (2-tailed) value is 0.120.
This represents the two-sided p-value that corresponds to a t value of -1.685 with 11 degrees of freedom.
Since the p-value of the test (.120) is not less than 0.05, we fail to reject the null hypothesis.
In other words, we do not have sufficient evidence to say that the true mean height of this species of plant is different than 15 inches.
Example 2: Two Sample t-test
A two sample t-test is used to test whether or not the mean values of two populations are equal.
For example, suppose researchers want to know if a new fuel treatment leads to a change in the average miles per gallon of a certain car. To test this, they conduct an experiment in which 12 cars receive the new fuel treatment and 12 cars do not.
The researchers perform a two sample t-test with the following null and alternative hypotheses:
- H0: μ1 = μ2 (average mpg between the two populations is equal)
- H1: μ1 ≠ μ2 (average mpg between the two populations is not equal)
They perform a two sample t-test in SPSS and get the following results:
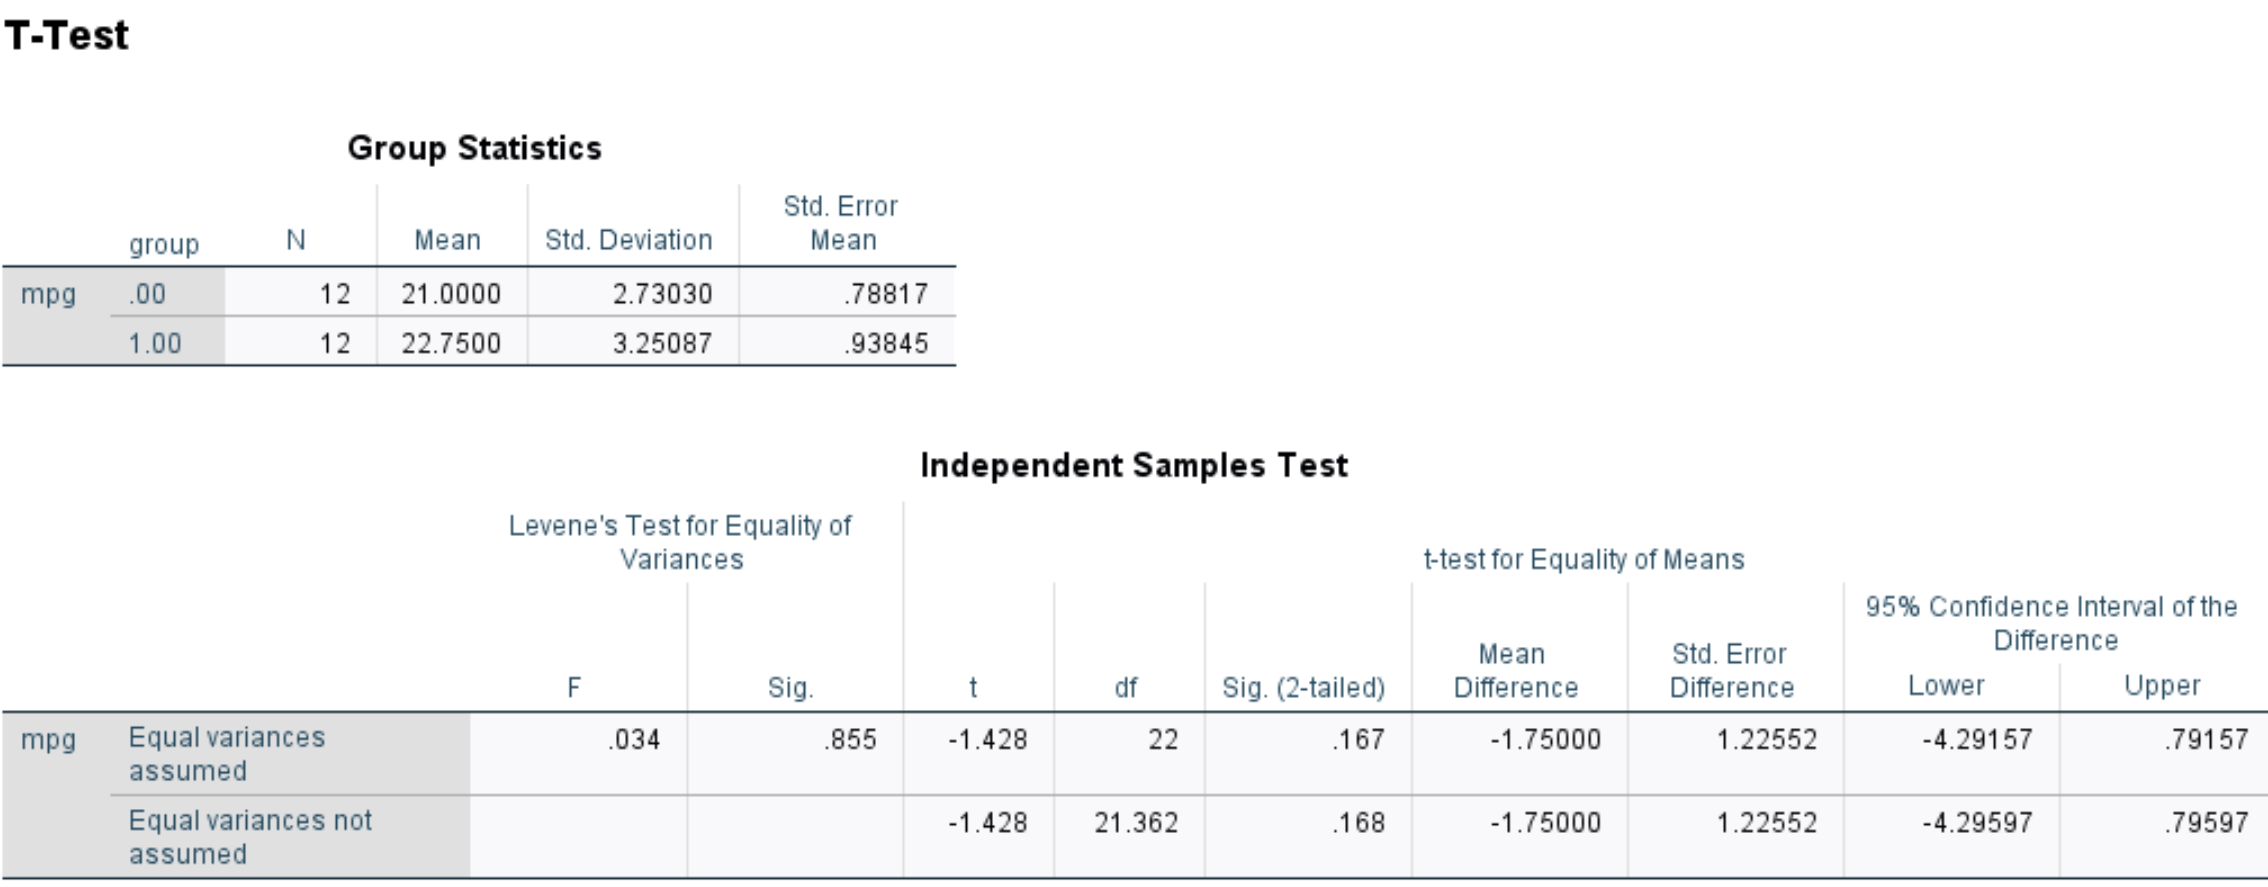
The Sig. (2-tailed) value is 0.167.
This represents the two-sided p-value that corresponds to a t value of -1.428 with 22 degrees of freedom.
Since the p-value of the test (.167) is not less than 0.05, we fail to reject the null hypothesis.
In other words, we do not have sufficient evidence to say that the true mean mpg is different between cars that receive treatment and cars that don’t.
Additional Resources
The following tutorials explain how to perform various statistical tests in SPSS:
How to Perform a One Sample t-test in SPSS
How to Perform a Two Sample t-test in SPSS
How to Perform a Paired Samples t-test in SPSS