A Chi-Square Test of Independence is used to determine whether or not there is a significant association between two categorical variables.
This tutorial explains how to perform a Chi-Square Test of Independence in SPSS.
Example: Chi-Square Test of Independence in SPSS
Suppose we want to know whether or not gender is associated with political party preference. We take a simple random sample of 500 voters and survey them on their political party preference. The following table shows the results of the survey:
| Republican | Democrat | Independent | Total | |
| Male | 120 | 90 | 40 | 250 |
| Female | 110 | 95 | 45 | 250 |
| Total | 230 | 185 | 85 | 500 |
Use the following steps to perform a Chi-Square Test of Independence in SPSS to determine if gender is associated with political party preference.
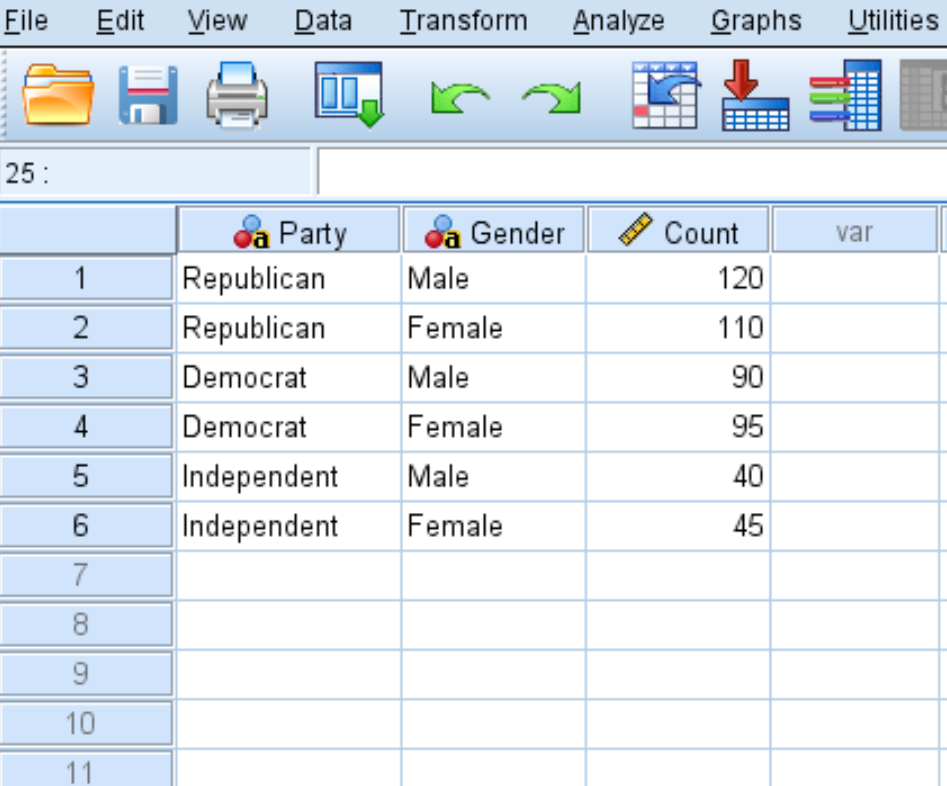
Step 1: Enter the data.
First, enter the data in the following format:
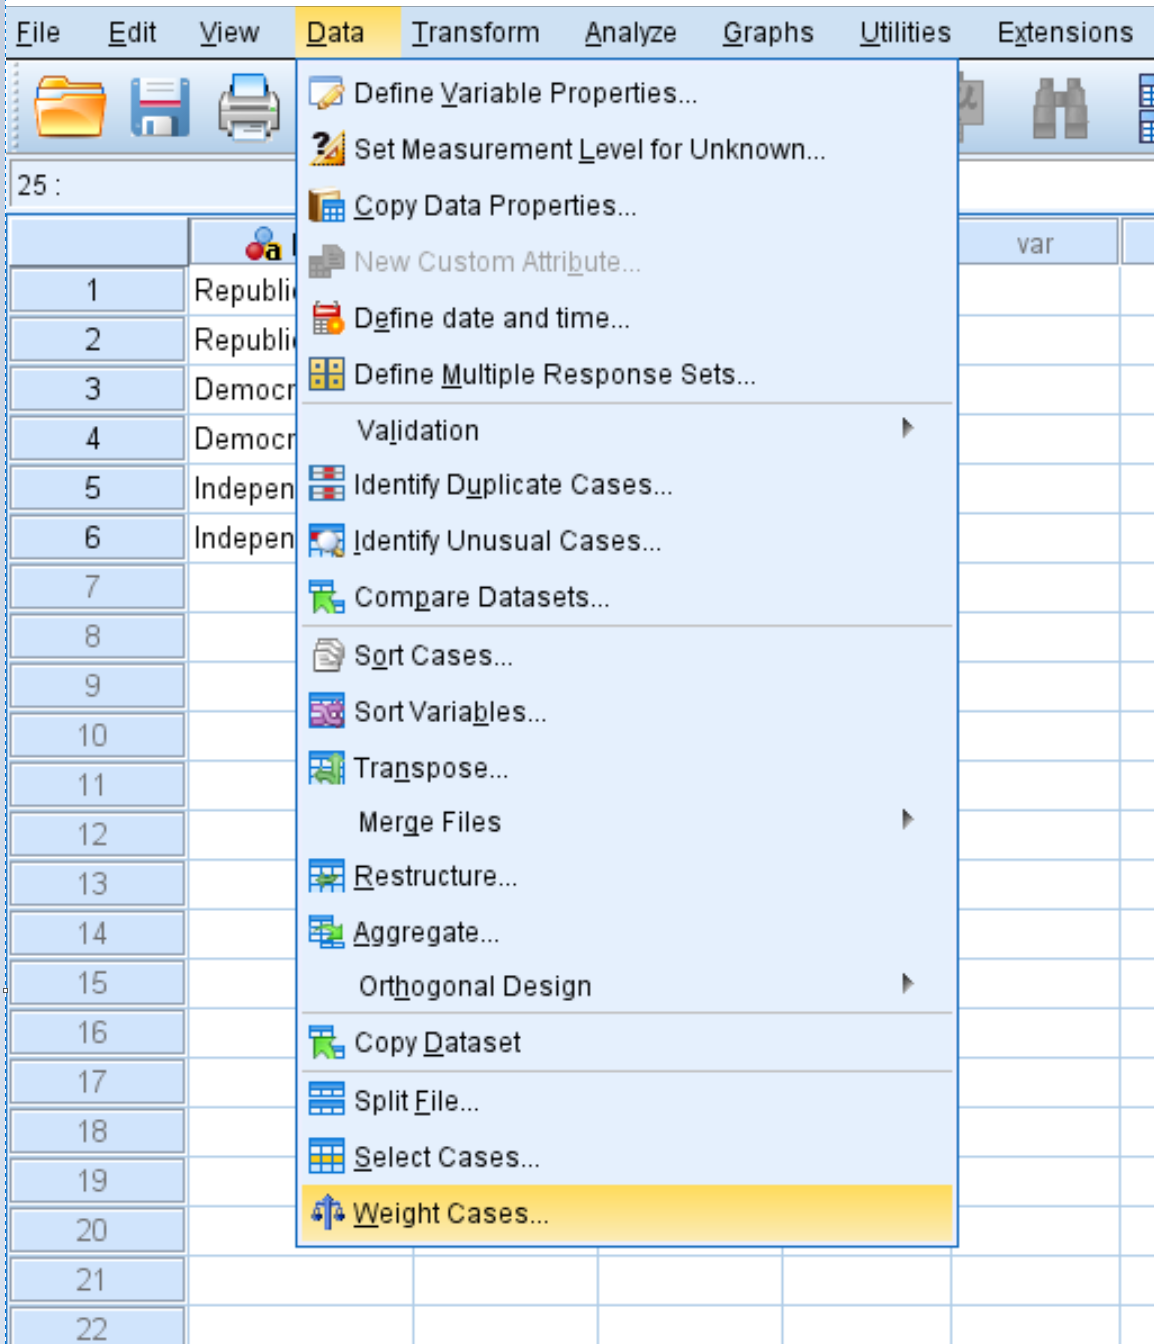
Step 2: Use weighted cases.
In order for the test to work correctly, we need to tell SPSS that the variables Party and Gender should be weighted by the variable Count.
Click the Data tab, then Weight Cases:
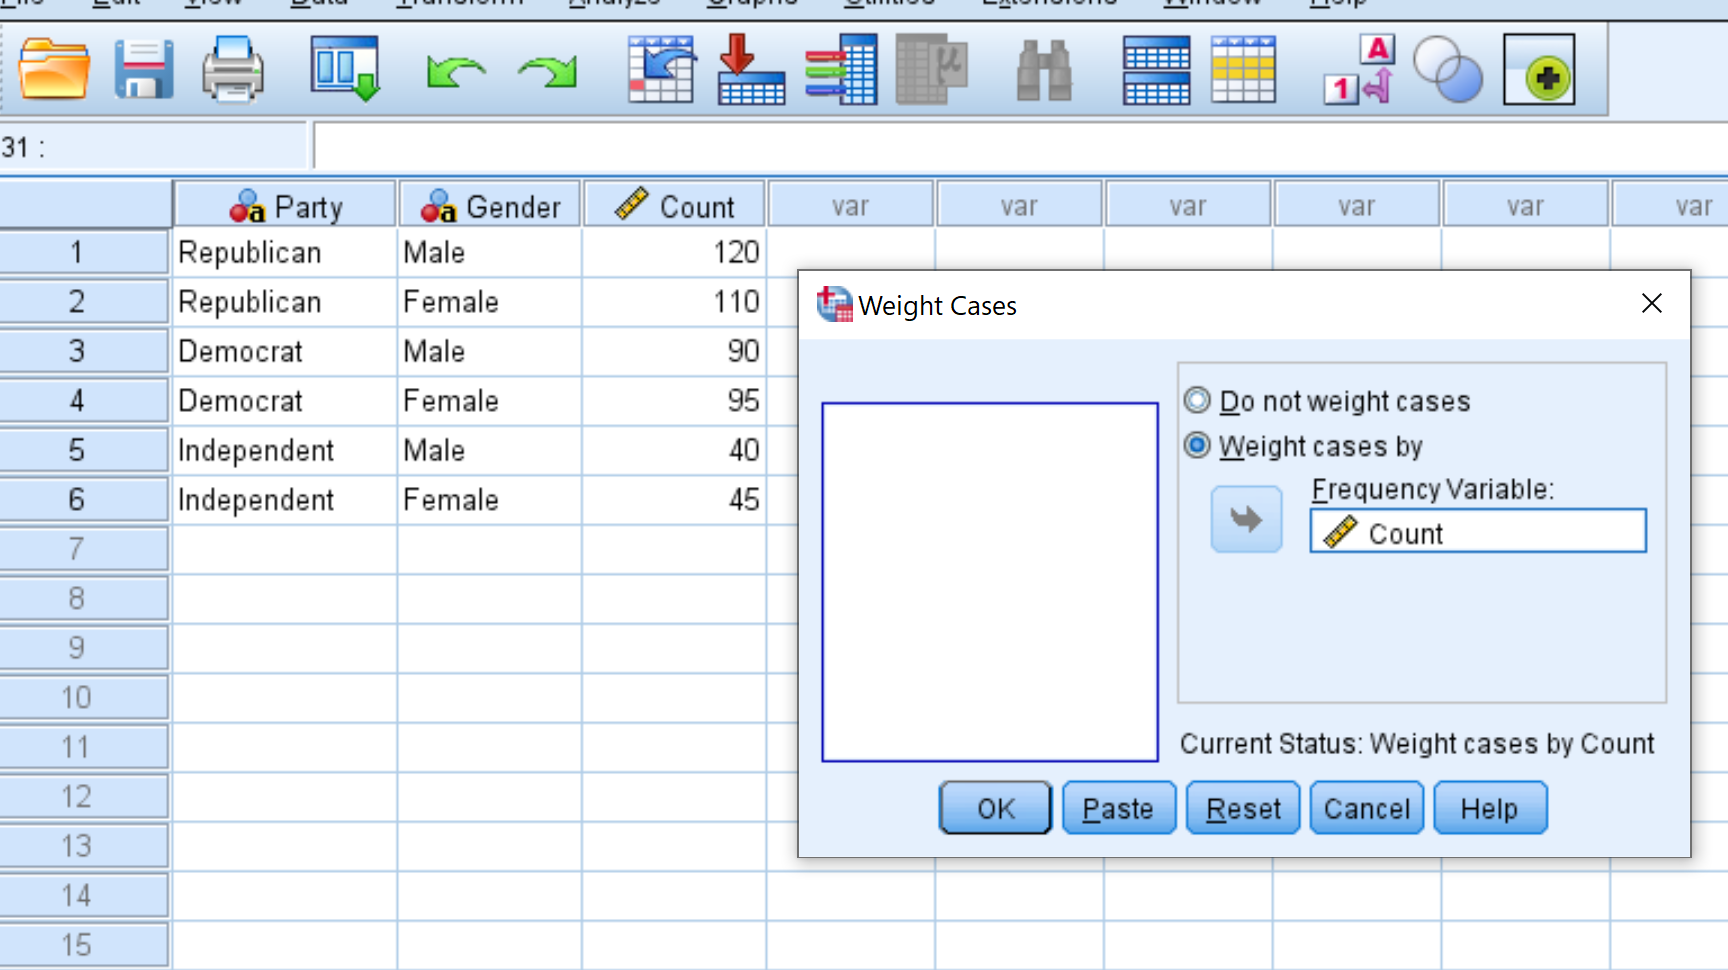
In the new window that pops up, drag the variable Count into the box labelled Test Variable List. Then click OK.
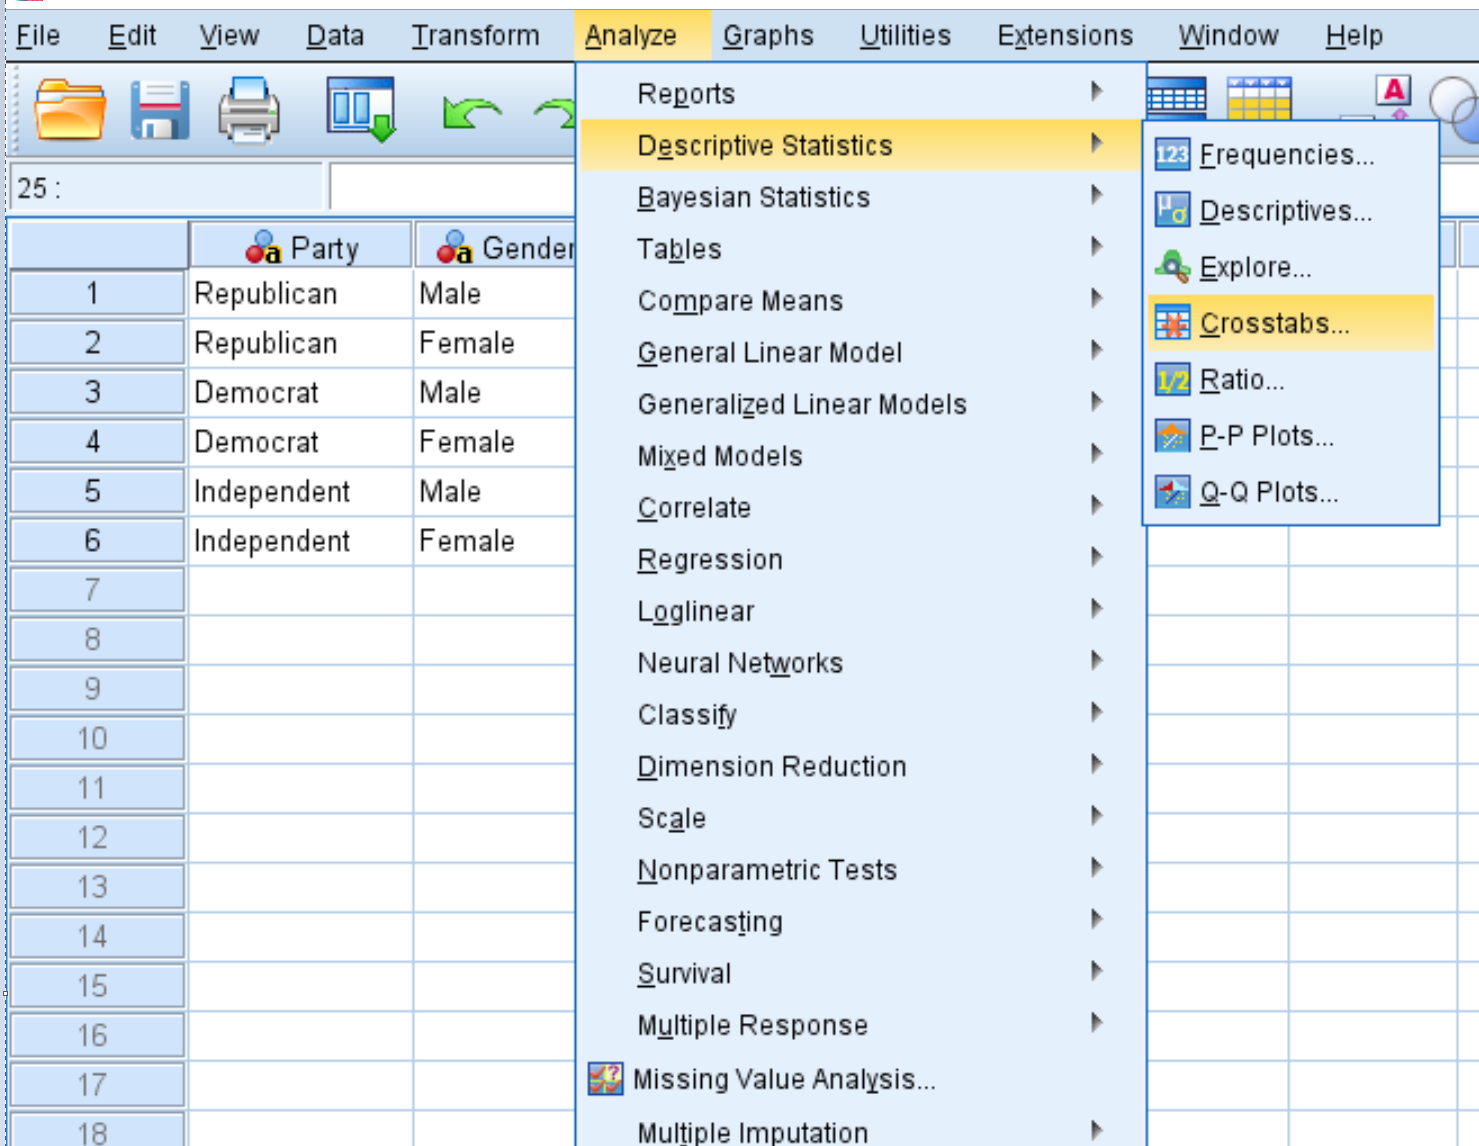
Step 3: Perform the Chi-Square Goodness of Fit Test.
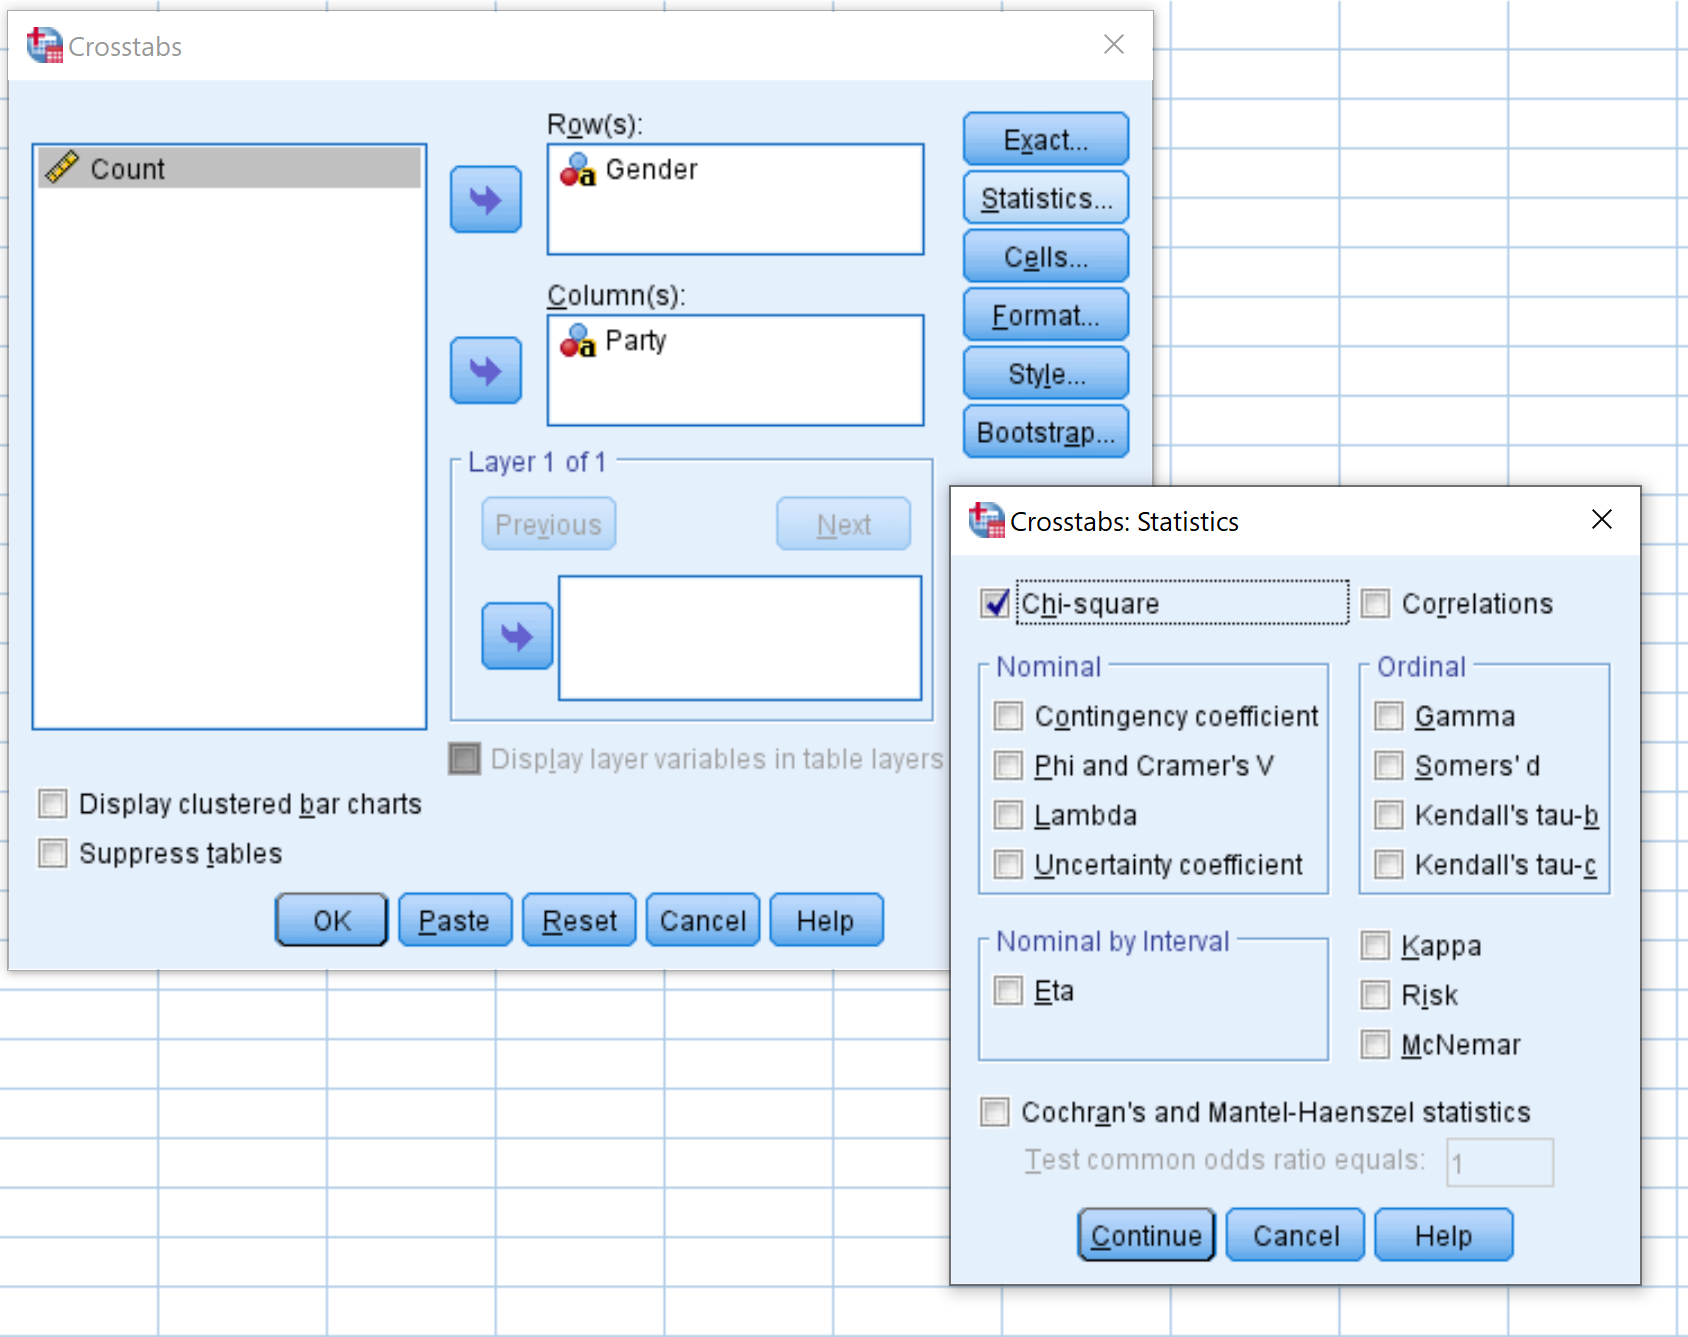
Click the Analyze tab, then Descriptive Statistics, then Crosstabs:
In the new window that pops up, drag the variable Gender into the box labelled Rows and the variable Party into the box labelled Columns. Then click Statistics and make sure the box next to Chi-square is checked. Click Continue. Then click OK.
Step 4: Interpret the results.
Once you click OK, the results of the Chi-Square Test of Independence will appear:
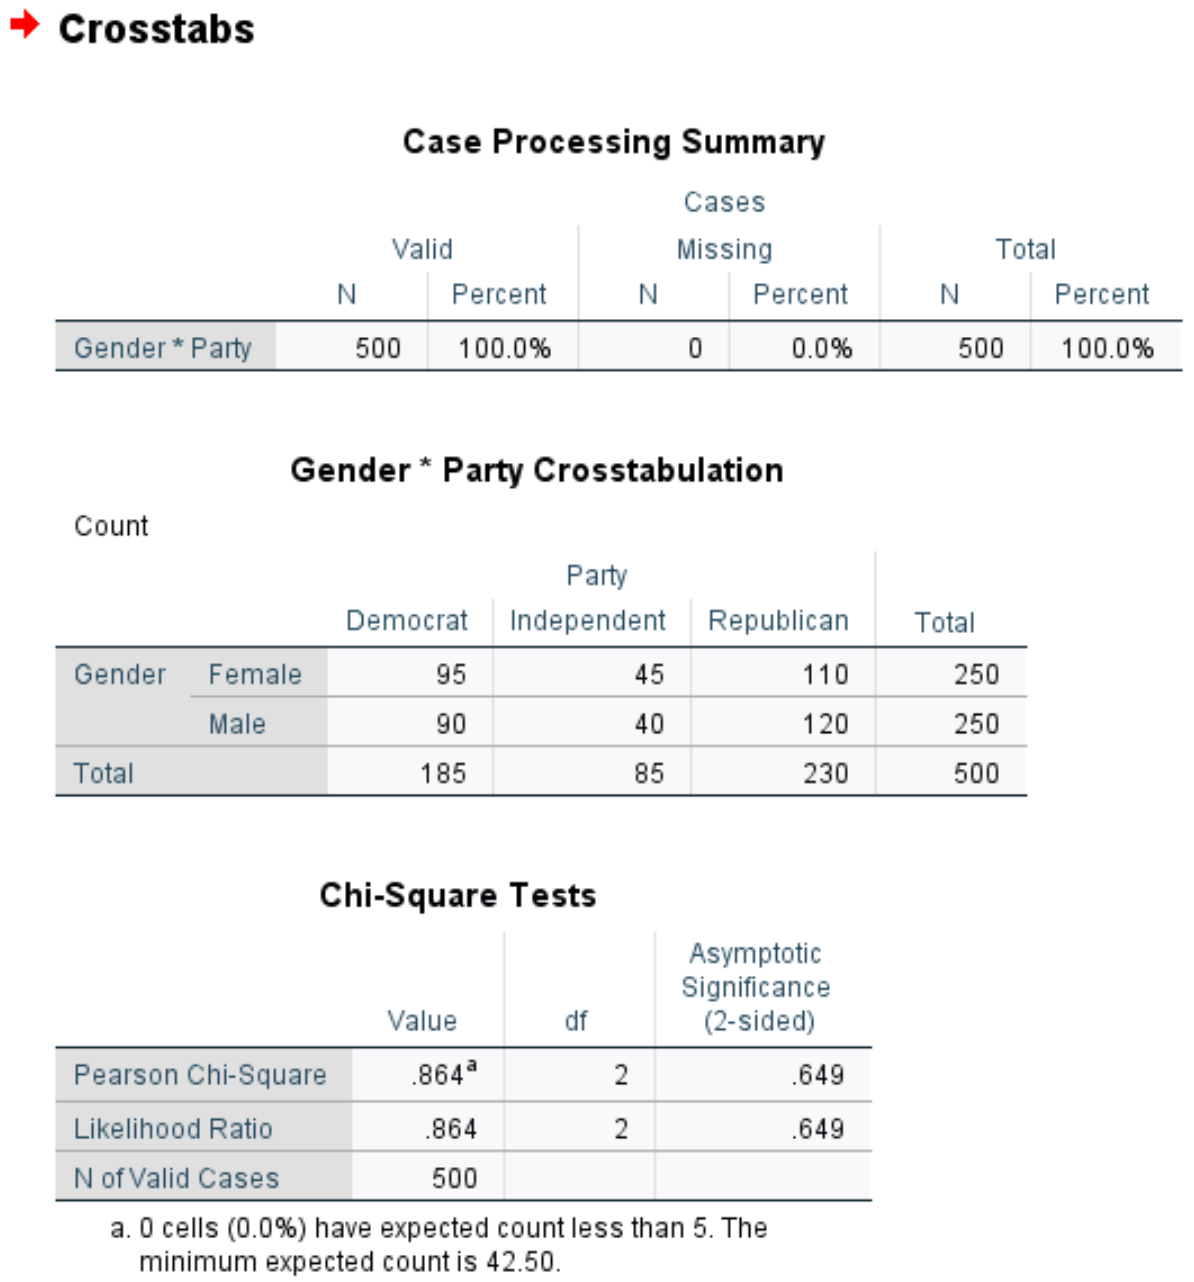
The first table displays the number of missing cases in the dataset. We can see that there are 0 missing cases in this example.
The second table displays a crosstab of the total number of individuals by gender and political party preference.
The third table shows the results of the Chi-Square Test of Independence. The test statistic is .864 and the corresponding two-sided p-value is .649.
The null hypothesis for the Chi-Square Test of Independence is that the two variables are independent. In this case, our null hypothesis is that gender and political party preference are independent.
Since the p-value (.649) of the test is not less than 0.05, we fail to reject the null hypothesis.
This means we do not have sufficient evidence to say that there is an association between gender and political party preference.