When the relationship between a set of predictor variables and a response variable is linear, methods like multiple linear regression can produce accurate predictive models.
However, when the relationship between a set of predictors and a response is highly non-linear and complex then non-linear methods can perform better.
One such example of a non-linear method is classification and regression trees, often abbreviated CART.
As the name implies, CART models use a set of predictor variables to build decision trees that predict the value of a response variable.
For example, suppose we have a dataset that contains the predictor variables Years played and average home runs along with the response variable Yearly Salary for hundreds of professional baseball players.
Here’s what a regression tree might look like for this dataset:
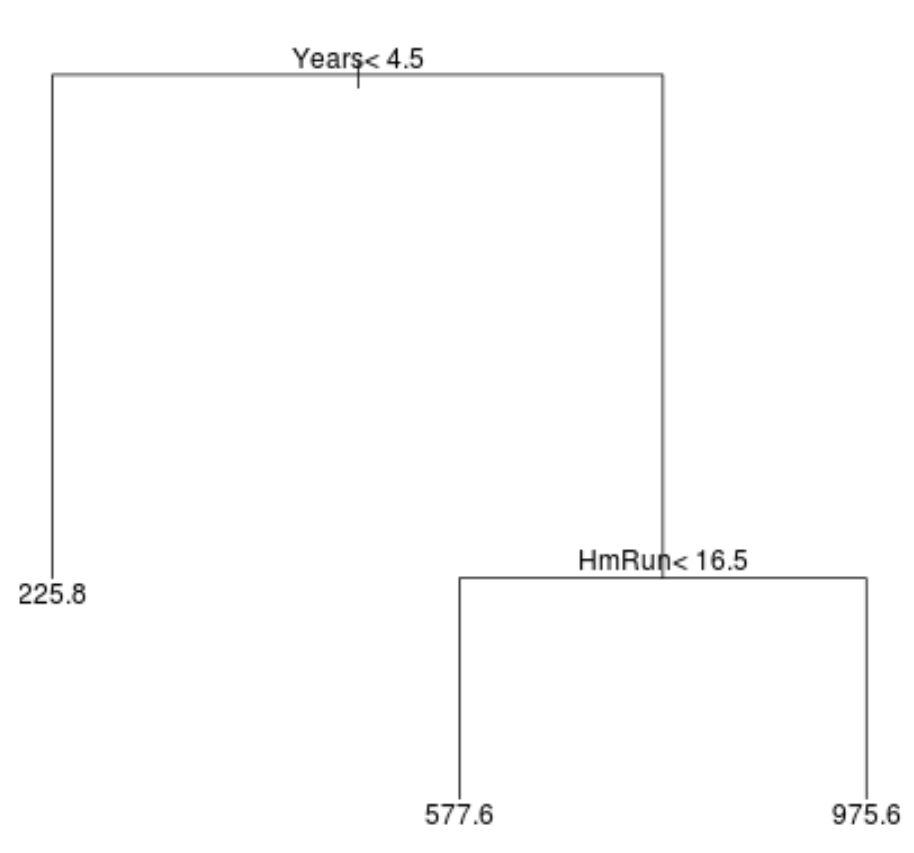
The way to interpret the tree is as follows:
- Players with less than 4.5 years played have a predicted salary of $225.8k.
- Players with greater than or equal to 4.5 years played and less than 16.5 average home runs have a predicted salary of $577.6k.
- Players with greater than or equal to 4.5 years played and greater than or equal to 16.5 average home runs have a predicted salary of $975.6k.
The results of this model should intuitively make sense: Players with more years of experience and more average home runs tend to earn higher salaries.
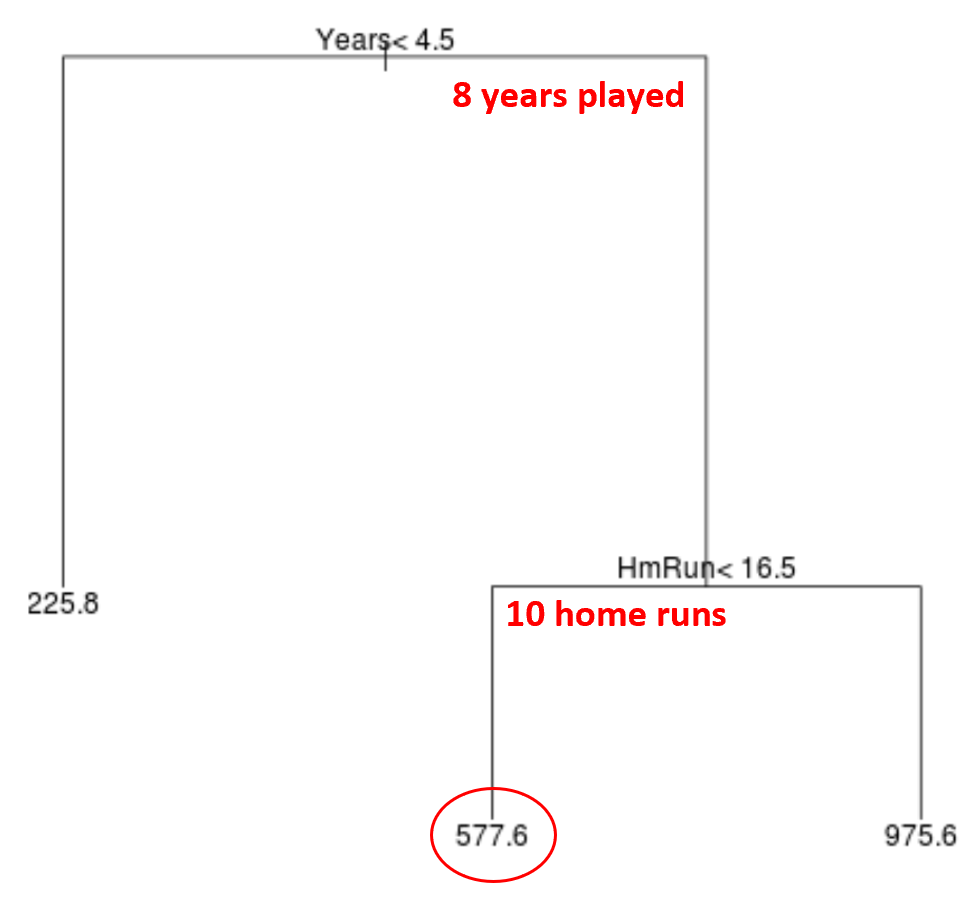
We can then use this model to predict the salary of a new player.
For example, suppose a given player has played 8 years and averages 10 home runs per year. According to our model, we would predict that this player has an annual salary of $577.6k.
A couple notes about the tree:
- The first predictor variable at the top of the tree is the most important, i.e. the most influential in predicting the value of the response variable. In this case, years played is able to predict salary better than average home runs.
- The regions at the bottom of the tree are known as terminal nodes. This particular tree has three terminal nodes.
Steps to Build CART Models
We can use the following steps to build a CART model for a given dataset:
Step 1: Use recursive binary splitting to grow a large tree on the training data.
First, we use a greedy algorithm known as recursive binary splitting to grow a regression tree using the following method:
- Consider all predictor variables X1, X2, … , Xp and all possible values of the cut points for each of the predictors, then choose the predictor and the cut point such that the resulting tree has the lowest RSS (residual standard error).
- For classification trees, we choose the predictor and cut point such that the resulting tree has the lowest misclassification rate.
- Repeat this process, stopping only when each terminal node has less than some minimum number of observations.
This algorithm is greedy because at each step of the tree-building process it determines the best split to make based only on that step, rather than looking ahead and picking a split that will lead to a better overall tree in some future step.
Step 2: Apply cost complexity pruning to the large tree to obtain a sequence of best trees, as a function of α.
Once we’ve grown the large tree, we then need to prune the tree using a method known as cost complexity pruning, which works as follows:
- For each possible tree with T terminal nodes, find the tree that minimizes RSS + α|T|.
- Note that as we increase the value of α, trees with more terminal nodes are penalized. This ensures that the tree doesn’t become too complex.
This process results in a sequence of best trees for each value of α.
Step 3: Use k-fold cross-validation to choose α.
Once we’ve found the best tree for each value of α, we can apply k-fold cross-validation to choose the value of α that minimizes the test error.
Step 4: Choose the final model.
Lastly, we choose the final model to be the one that corresponds to the chosen value of α.
Pros & Cons of CART Models
CART models offer the following pros:
- They are easy to interpret.
- They are easy to explain.
- They are easy to visualize.
- They can be applied to both regression and classification problems.
However, CART models come with the following con:
- They tend to not have as much predictive accuracy as other non-linear machine learning algorithms. However, by aggregating many decision trees with methods like bagging, boosting, and random forests, their predictive accuracy can be improved.
Related: How to Fit Classification and Regression Trees in R