A residual plot is used to assess whether or not the residuals in a regression analysis are normally distributed and whether or not they exhibit heteroscedasticity.
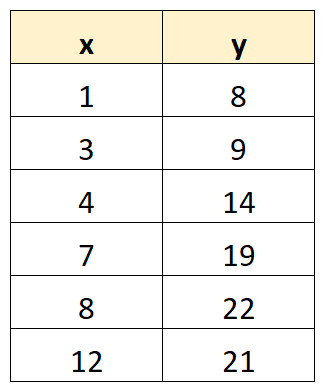
This tutorial provides a step-by-step example of how to create a residual plot for the following dataset on a TI-84 calculator:
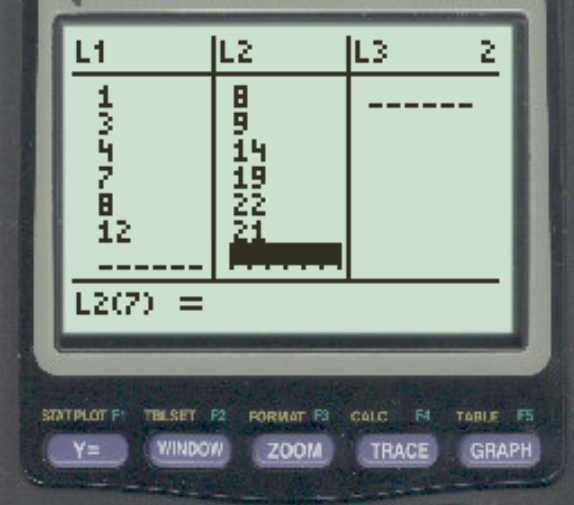
Step 1: Enter the Data
First, we will enter the data values.
Press Stat, then press EDIT. Then enter the x-values of the dataset in column L1 and the y-values in column L2:
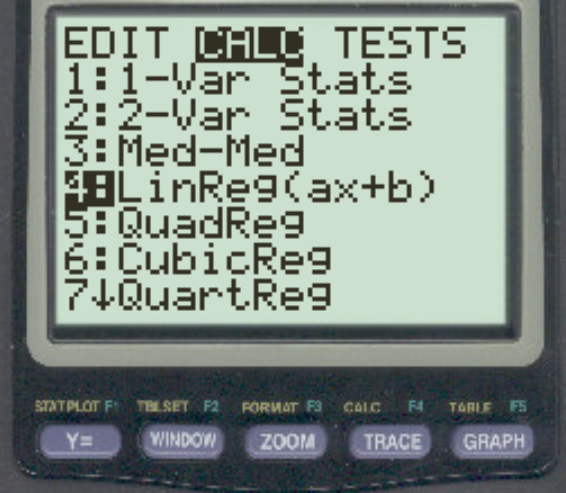
Step 2: Perform Linear Regression
Next, we will fit a linear regression model to the dataset.
Press Stat, then scroll over to CALC. Then scroll down to LinReg(ax+b) and press ENTER.
Press ENTER once again to perform linear regression:
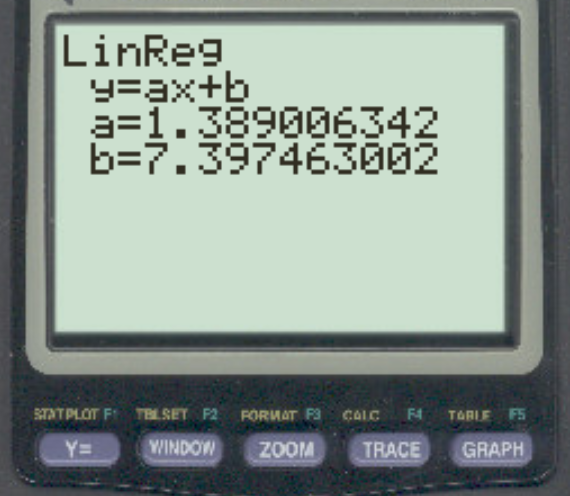
The fitted regression model is: y = 7.397 + 1.389x
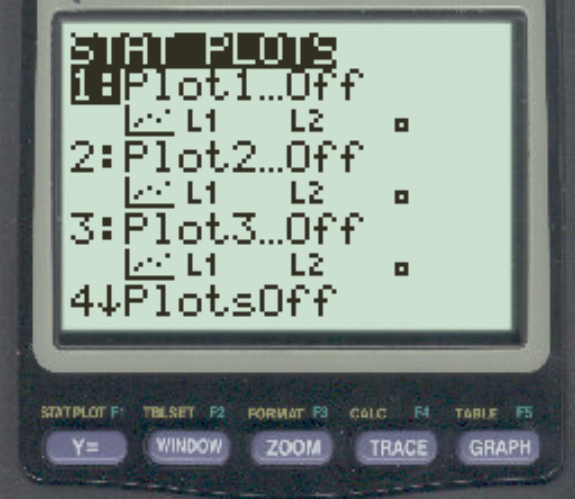
Step 3: Create the Residual Plot
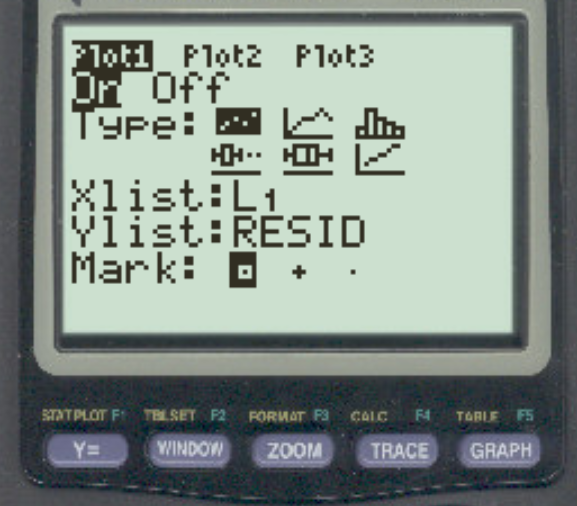
Next, press 2nd and then press Y=. In the new screen that appears, press ENTER on the first plot option.
Hover over the “On” option and press press ENTER. Then scroll down to YList and press 2nd and then press STAT. Then press “7” to choose the residuals:

The term “RESID” will then appear next to Ylist:
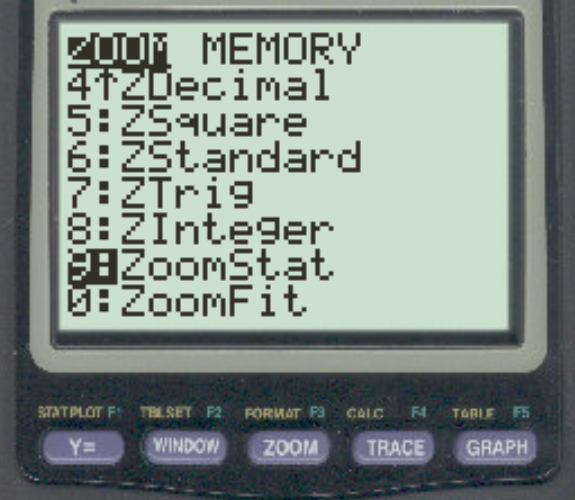
Lastly, press ZOOM and then scroll down to ZoomStat and press ENTER.
The residual plot will appear:

The x-axis displays the x values from the dataset and the y-axis displays the residuals from the regression model.
To see the actual values of the residuals, press 2nd and then press STAT. Then press “7” to choose the residuals:
Press ENTER once more to display the residuals.
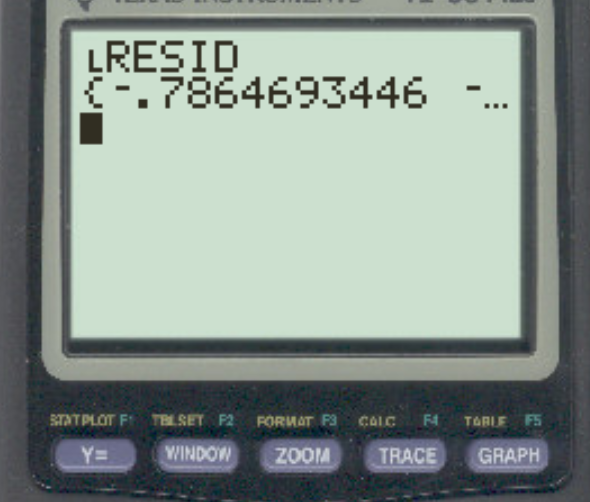
Scroll to the right to see the values for each of the residuals.
Additional Resources
How to Perform Linear Regression on a TI-84 Calculator
How to Perform Quadratic Regression on a TI-84 Calculator
How to Calculate a Correlation Coefficient on a TI-84 Calculator