An outlier is an observation that lies abnormally far away from other values in a dataset. Outliers can be problematic because they can effect the results of an analysis.
This tutorial explains how to identify and handle outliers in SPSS.
How to Identify Outliers in SPSS
Suppose we have the following dataset that shows the annual income (in thousands) for 15 individuals:

One way to determine if outliers are present is to create a box plot for the dataset. To do so, click the Analyze tab, then Descriptive Statistics, then Explore:

In the new window that pops up, drag the variable income into the box labelled Dependent List. Then click Statistics and make sure the box next to Percentiles is checked. Then click Continue. Then click OK.

Once you click OK, a box plot will appear:
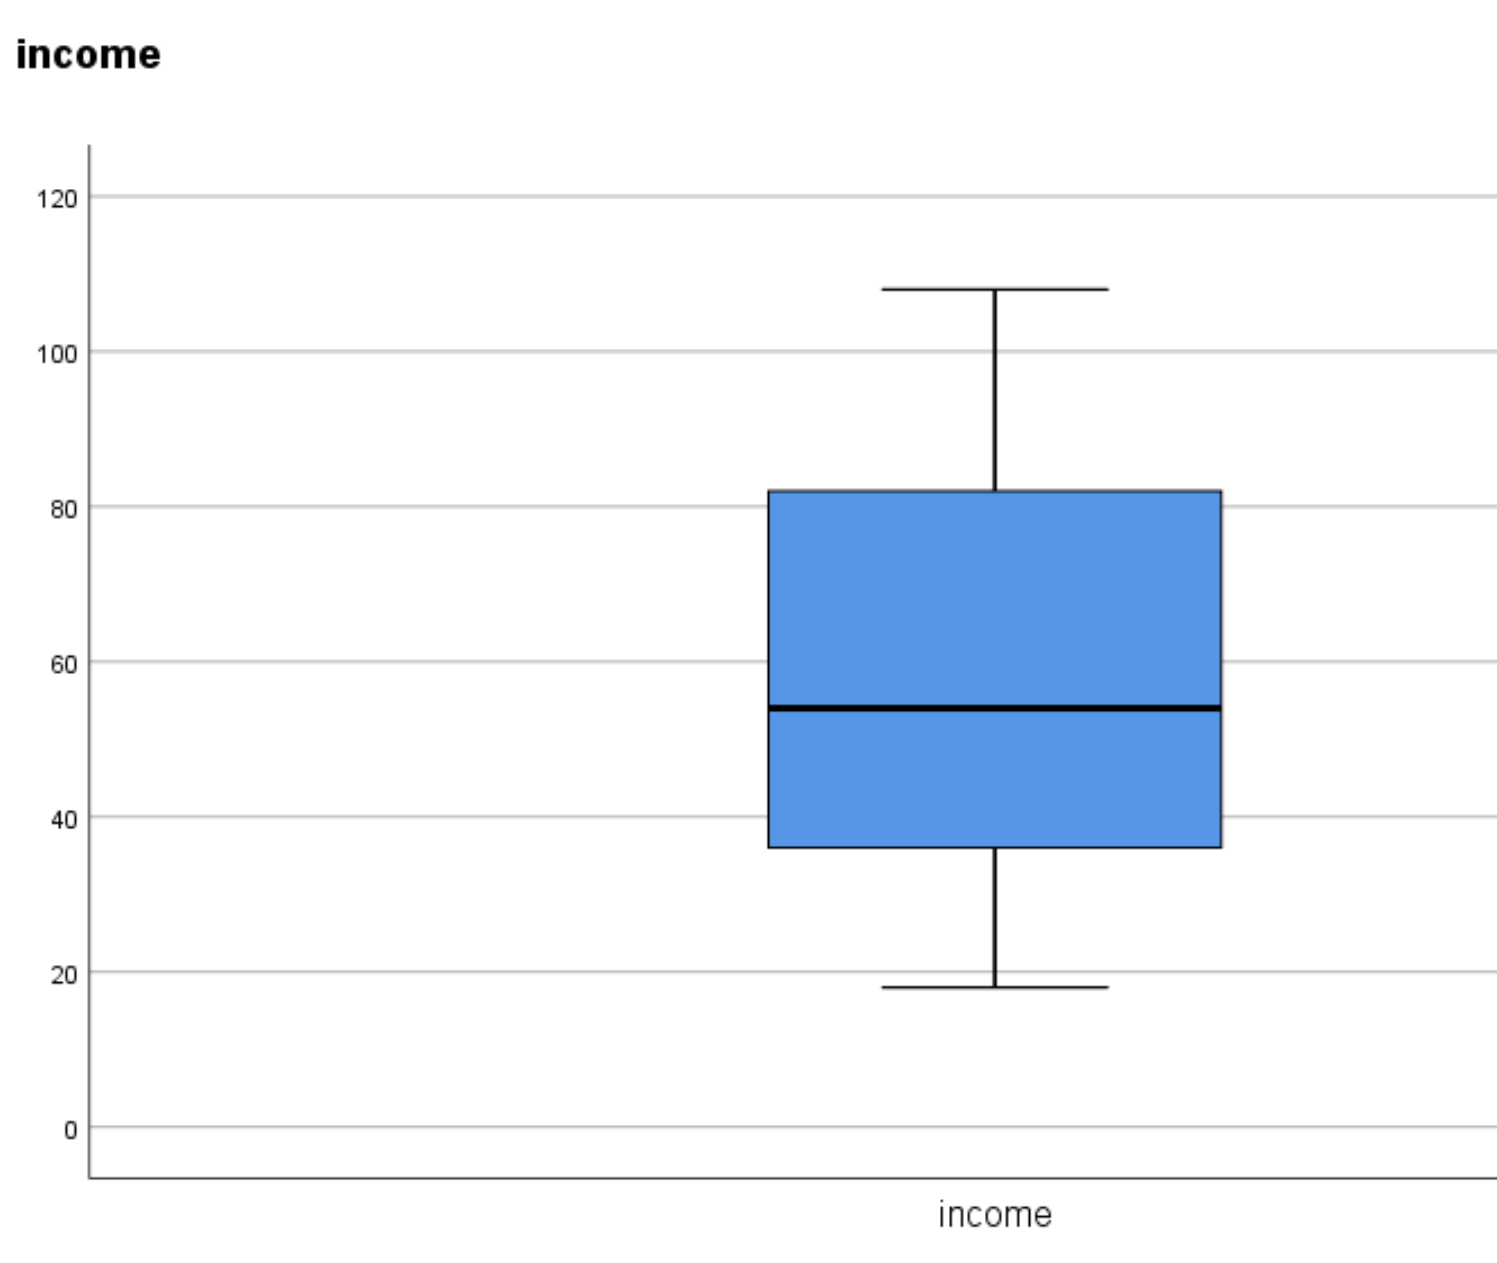
If there are no circles or asterisks on either end of the box plot, this is an indication that no outliers are present.
SPSS considers any data value to be an outlier if it lies outside of the following ranges:
- 3rd quartile + 1.5*interquartile range
- 1st quartile – 1.5*interquartile range
We can calculate the interquartile range by taking the difference between the 75th and 25th percentile in the row labeled Tukey’s Hinges in the output:
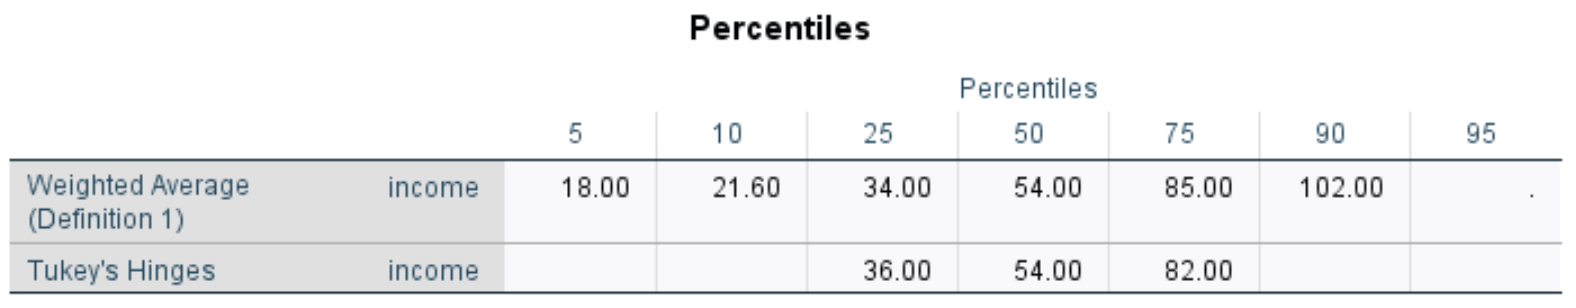
For this dataset, the interquartile range is 82 – 36 = 46. Thus, any values outside of the following ranges would be considered outliers:
- 82 + 1.5*46 = 151
- 36 – 1.5*46 = -33
Obviously income can’t be negative, so the lower bound in this example isn’t useful. However, any income over 151 would be considered an outlier.
For example, suppose the largest value in our dataset was instead 152. Here is the box plot for this dataset:
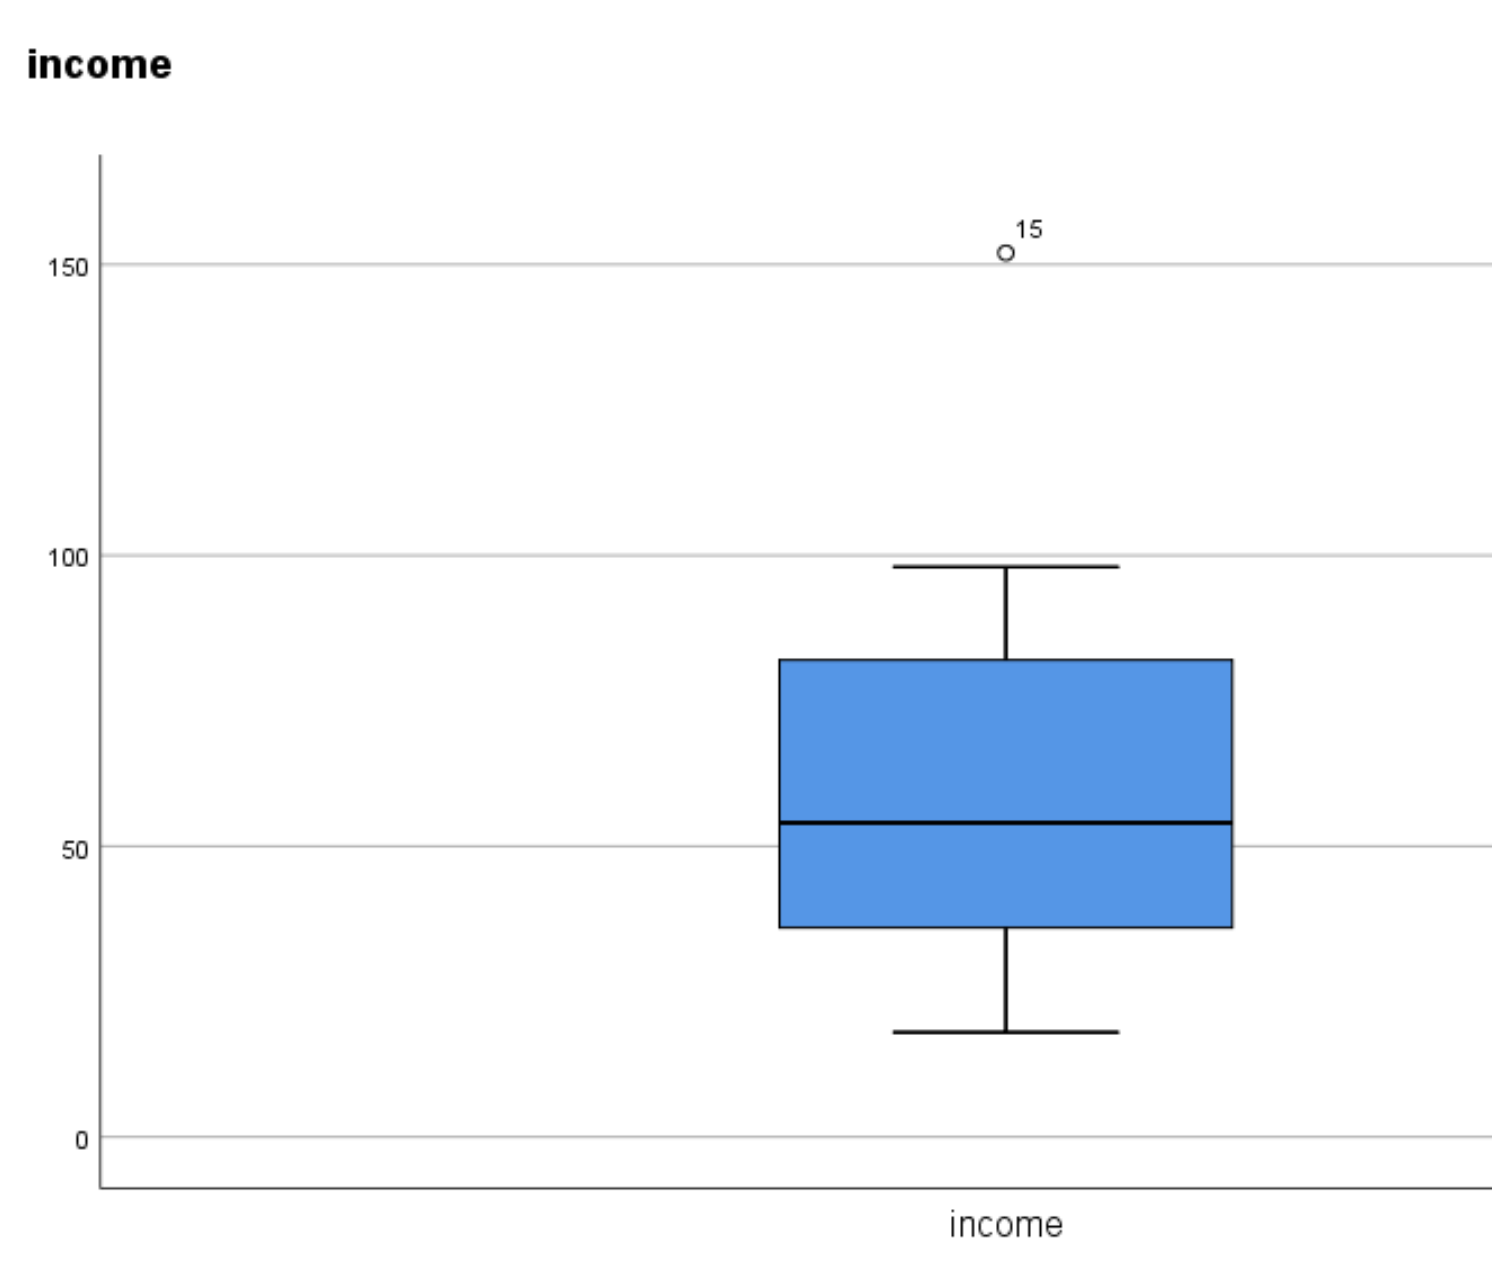
The circle is an indication that an outlier is present in the data. The number 15 indicates which observation in the dataset is the outlier.
SPSS also considers any data value to be an extreme outlier if it lies outside of the following ranges:
- 3rd quartile + 3*interquartile range
- 1st quartile – 3*interquartile range
Thus, any values outside of the following ranges would be considered extreme outliers in this example:
- 82 + 3*46 = 220
- 36 – 3*46 = -102
For example, suppose the largest value in our dataset was 221. Here is the box plot for this dataset:
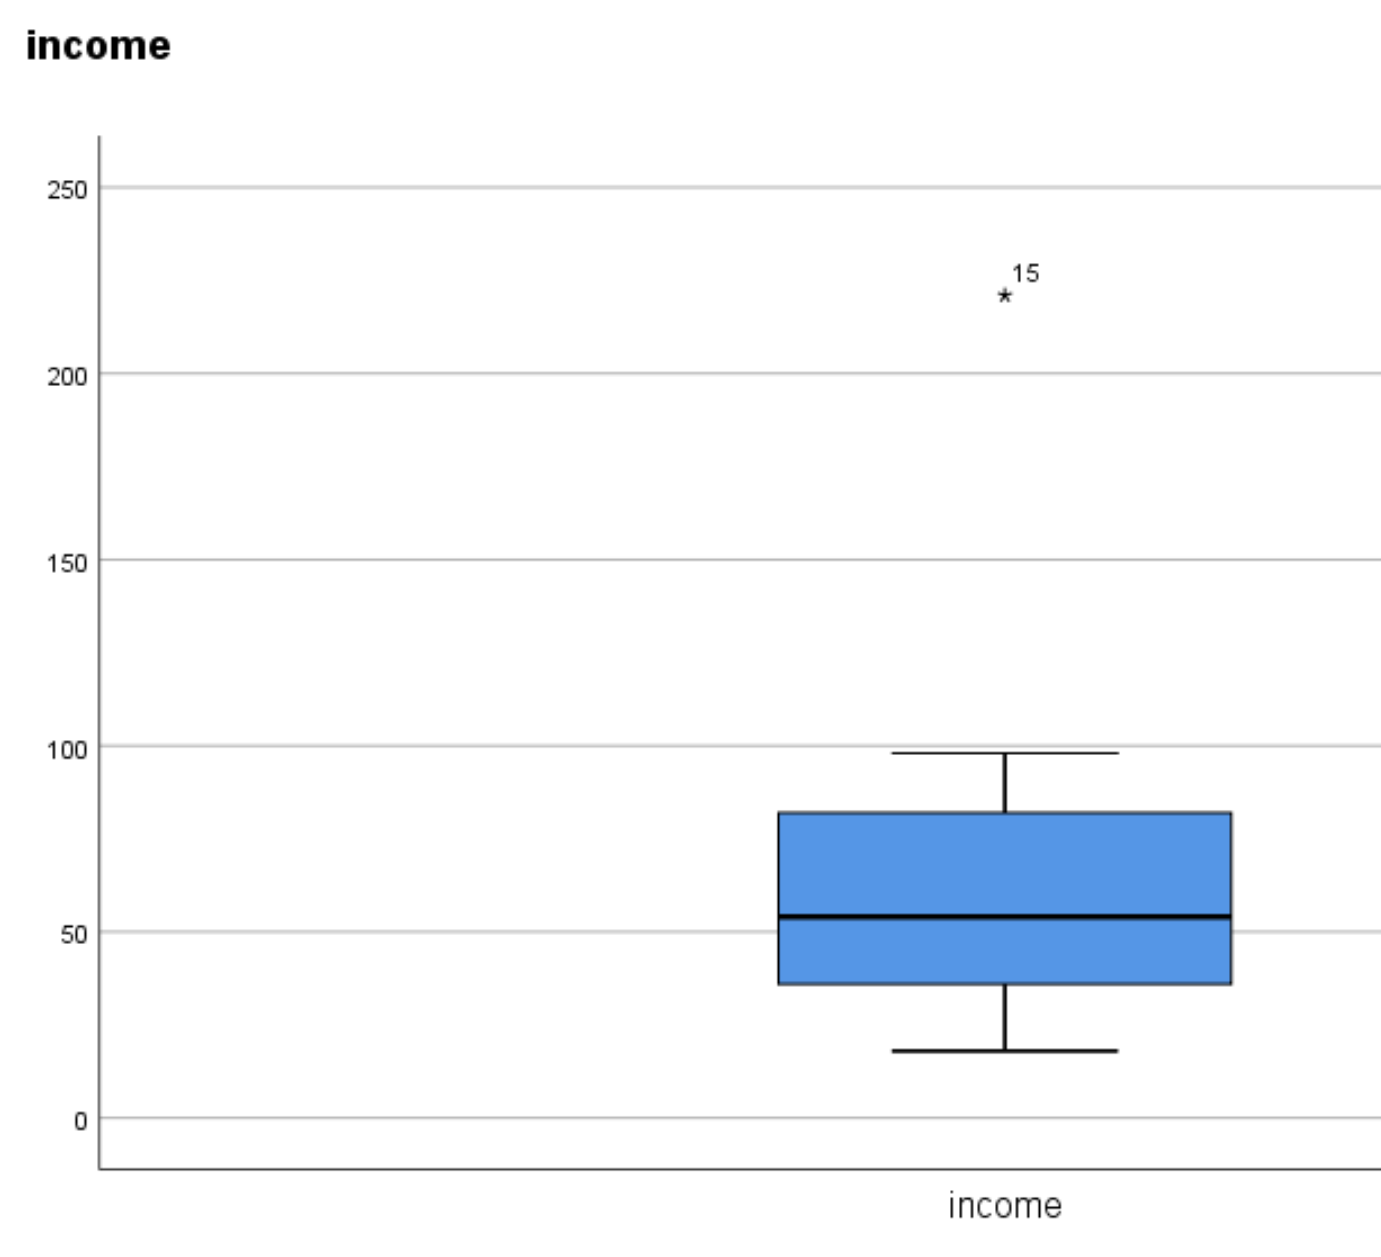
The asterisk (*) is an indication that an extreme outlier is present in the data. The number 15 indicates which observation in the dataset is the extreme outlier.
How to Handle Outliers
If an outlier is present in your data, you have a few options:
1. Make sure the outlier is not the result of a data entry error.
Sometimes an individual simply enters the wrong data value when recording data. If an outlier is present, first verify that the value was entered correctly and that it wasn’t an error.
2. Remove the outlier.
If the value is a true outlier, you may choose to remove it if it will have a significant impact on your overall analysis. Just make sure to mention in your final report or analysis that you removed an outlier.
3. Assign a new value to the outlier.
If the outlier turns out to be a result of a data entry error, you may decide to assign a new value to it such as the mean or the median of the dataset.
Additional Resources
If you’re working with several variables at once, you may want to use the Mahalanobis distance to detect outliers.