A histogram is a chart that helps us visualize the distribution of values in a dataset.
The x-axis of a histogram displays bins of data values and the y-axis tells us how many observations in a dataset fall in each bin.
Although histograms are useful for visualizing distributions, it’s not always obvious what the mean and median values are just from looking at the histograms.
And while it’s not possible to find the exact mean and median values of a distribution just from looking at a histogram, it’s possible to estimate both values. This tutorial explains how to do so.
How to Estimate the Mean of a Histogram
We can use the following formula to find the best estimate of the mean of any histogram:
Best Estimate of Mean: Σmini / N
where:
- mi: The midpoint of the ith bin
- ni: The frequency of the ith bin
- N: The total sample size
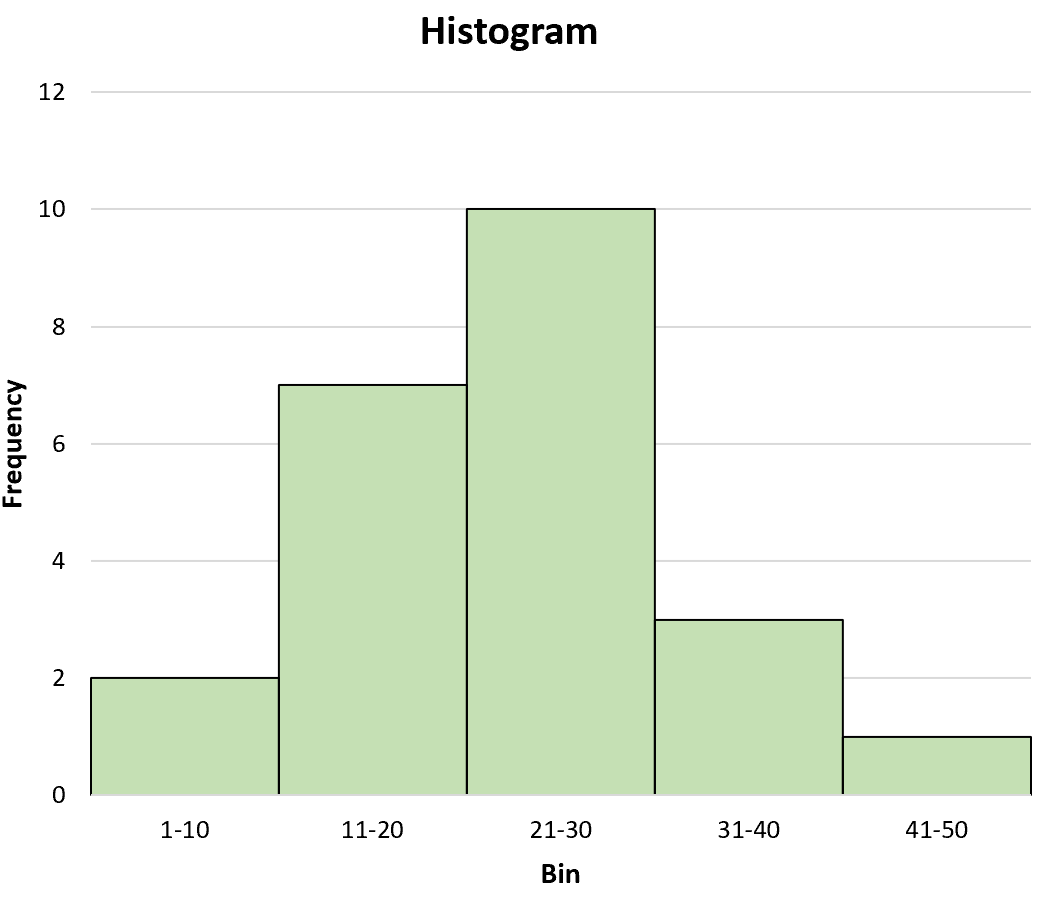
For example, consider the following histogram:
Our best estimate of the mean would be:
Mean = (5.5*2 + 15.5*7 + 25.5*10 + 35.5*3 + 45.5*1) / 23 = 22.89.
By looking at the histogram, this seems like a reasonable estimate of the mean.
How to Estimate the Median of a Histogram
We can use the following formula to find the best estimate of the median of any histogram:
Best Estimate of Median: L + ( (n/2 – F) / f ) * w
where:
- L: The lower limit of the median group
- n: The total number of observations
- F: The cumulative frequency up to the median group
- f: The frequency of the median group
- w: The width of the median group
Once again, consider the following histogram:
Our best estimate of the median would be:
Median = 21 + ( (25/2 – 9) / 10) * 9 = 24.15.
From looking at the histogram, this also seems to be a reasonable estimate of the median.
Related: How to Estimate the Standard Deviation of Any Histogram
Additional Resources
How to Find Mean, Median, & Mode in Stem-and-Leaf Plots
How to Calculate Mean from Frequency Tables
When to Use Mean vs. Median