A Chi-Square Goodness of Fit Test is used to determine whether or not a categorical variable follows a hypothesized distribution.
This tutorial explains how to perform a Chi-Square Goodness of Fit Test in SPSS.
Example: Chi-Square Goodness of Fit Test in SPSS
A shop owner claims that an equal number of customers come into his shop each weekday. To test this hypothesis, a researcher records the number of customers that come into the shop on a given week and finds the following:
- Monday: 50 customers
- Tuesday: 60 customers
- Wednesday: 40 customers
- Thursday: 47 customers
- Friday: 53 customers
Use the following steps to perform a Chi-Square goodness of fit test in SPSS to determine if the data is consistent with the shop owner’s claim.
Step 1: Input the data.
First, enter the data into SPSS in the following format:

Step 2: Use weighted cases.
In order for the test to work correctly, we need to tell SPSS that the variable “Day” should be weighted by the variable “Count.”
Click the Data tab, then Weight Cases:

In the new window that pops up, drag the variable Count into the box labelled Test Variable List. Then click OK.

Step 3: Perform the Chi-Square Goodness of Fit Test.
Click on the Analyze tab, then Nonparametric Tests, then Legacy Dialogs, then Chi-Square:

In the new window that pops up, drag the variable Count into the box labelled Test Variable List.
Leave the label checked next to All categories equal since each of our categories (i.e. days of the week) have the same expected number of visitors each day. Then click OK.
Step 4: Interpret the results.
Once you click OK, the results of the Chi-Square Goodness of Fit Test will appear:
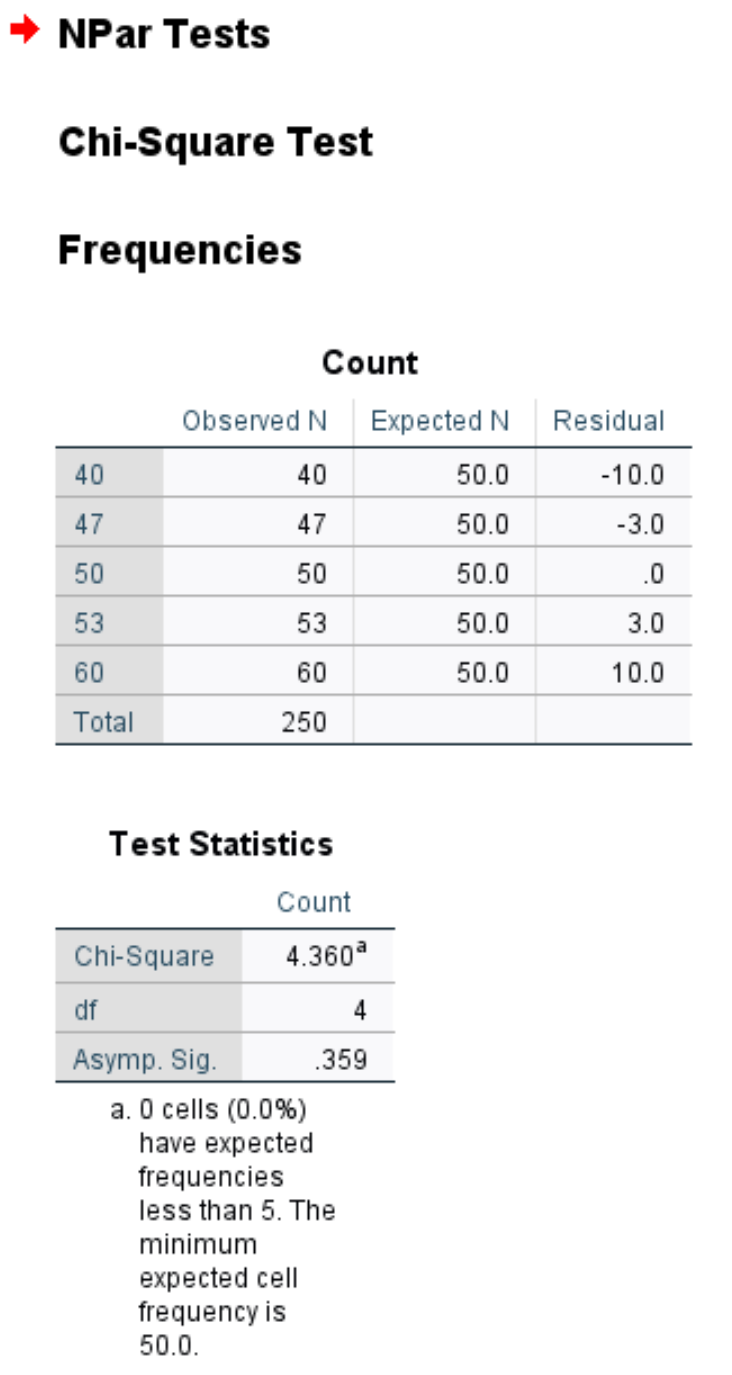
The first table shows the observed and expected number of customers each day of the week, along with the residual (i.e. the difference) between observed and expected.
The second table displays the following numbers:
Chi-Square: The Chi-Square test statistic, found to be 4.36.
df: The degrees of freedom, calculated as #categories-1 = 5-1 = 4.
Asymp. Sig: The p-value that corresponds to a Chi-Square value of 4.36 with 4 degrees of freedom, found to be .359. This value can also be found by using the Chi-Square Score to P Value Calculator.
Since the p-value (.359) is not less than 0.05, we fail to reject the null hypothesis. This means we do not have sufficient evidence to say that the true distribution of customers is different from the distribution that the shop owner claimed.