McNemar’s Test is a test we can use to determine if there is a statistically significant difference in proportions between paired data.
This tutorial explains how to perform McNemar’s Test in Stata.
Example: McNemar’s Test in Stata
Suppose researchers want to know if a certain marketing video can change people’s opinion of a particular law. They survey 100 people to find out if they do or do not support the law. Then, they show all 100 people the marketing video and survey them again once the video is over.
The following table shows the total number of people who supported the law both before and after viewing the video:
| Before Marketing Video | ||
|---|---|---|
| After Marketing Video | Support | Do not support |
| Support | 30 | 40 |
| Do not Support | 12 | 18 |
To determine if there was a statistically significant difference in the proportion of people who supported the law before and after viewing the video, we can perform McNemar’s Test.
In Stata, we can use the mcci command to perform McNemar’s Test. We enter the counts in the 2×2 table from left to right, top to bottom:
mcci 30 40 12 18
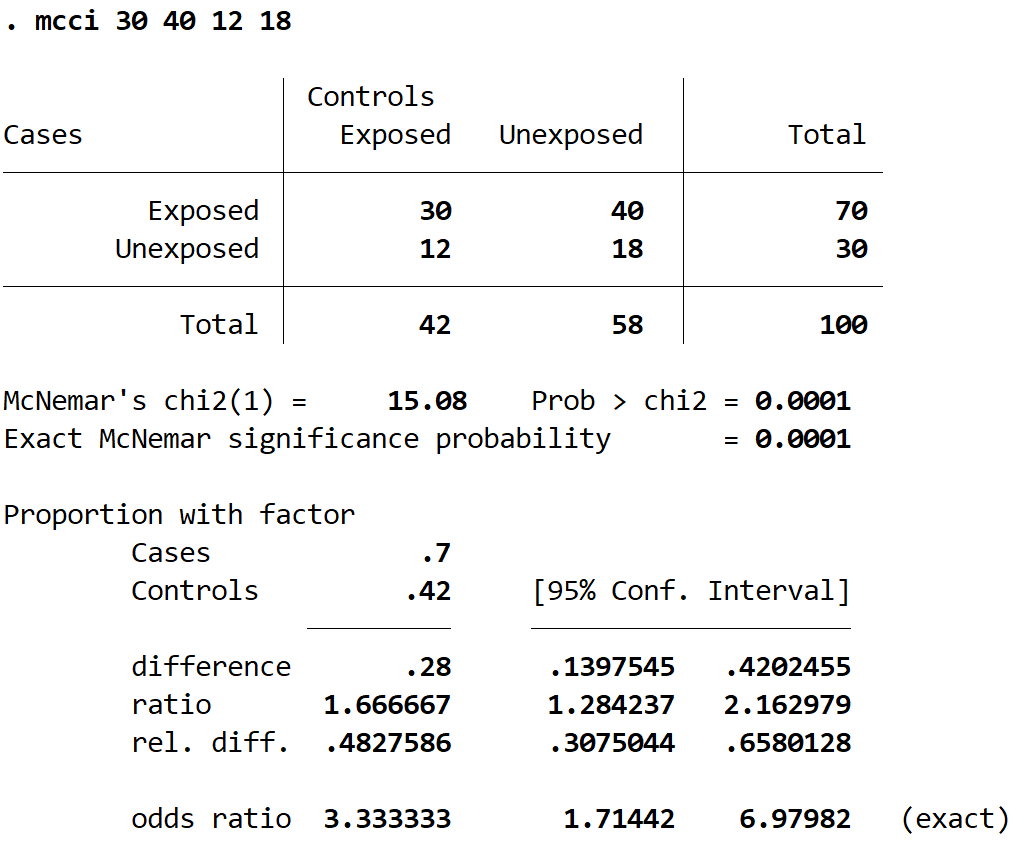
Here is how to interpret the output:
2×2 table: Stata displays a 2×2 table of the counts using the conventional labels that are often seen in case-control studies. We can see that the total counts add up to 100.
McNemar’s chi2(1): This is the Chi-Square test statistic, which turns out to be 15.08. Stata uses the following formula to calculate this value: (40-12)2 / (40+12) = 784 / 52 = 15.0769.
Prob > chi2: This is the p-value associated with the Chi-Square test statistic. It turns out to to be 0.0001. Because this value is less than 0.05, we can reject the null hypothesis and conclude that the proportion of people who supported the law before and after watching the marketing video was statistically significant different.
A Note on the Chi-Square Calculation
Given the following 2×2 table:
| Before Marketing Video | ||
|---|---|---|
| After Marketing Video | Support | Do not support |
| Support | A | B |
| Do not Support | C | D |
Stata uses the formula (B-C)2 / (B+C) to calculate the Chi-Square test statistic.
However, some statistical textbooks suggest using the formula (|B-C| – 1)2 / (B+C) as a continuity correction when some counts in the table are small. As a rule of thumb, this correction is typically applied when any of the cell counts are less than 5.