A one proportion z-test is used to compare an observed proportion to a theoretical one.
This tutorial explains the following:
- The motivation for performing a one proportion z-test.
- The formula to perform a one proportion z-test.
- An example of how to perform a one proportion z-test.
One Proportion Z-Test: Motivation
Suppose we want to know if the proportion of people in a certain county that are in favor of a certain law is equal to 60%. Since there are thousands of residents in the county, it would be too costly and time-consuming to go around and ask each resident about their stance on the law.
Instead, we might select a simple random sample of residents and ask each one whether or not they support the law:
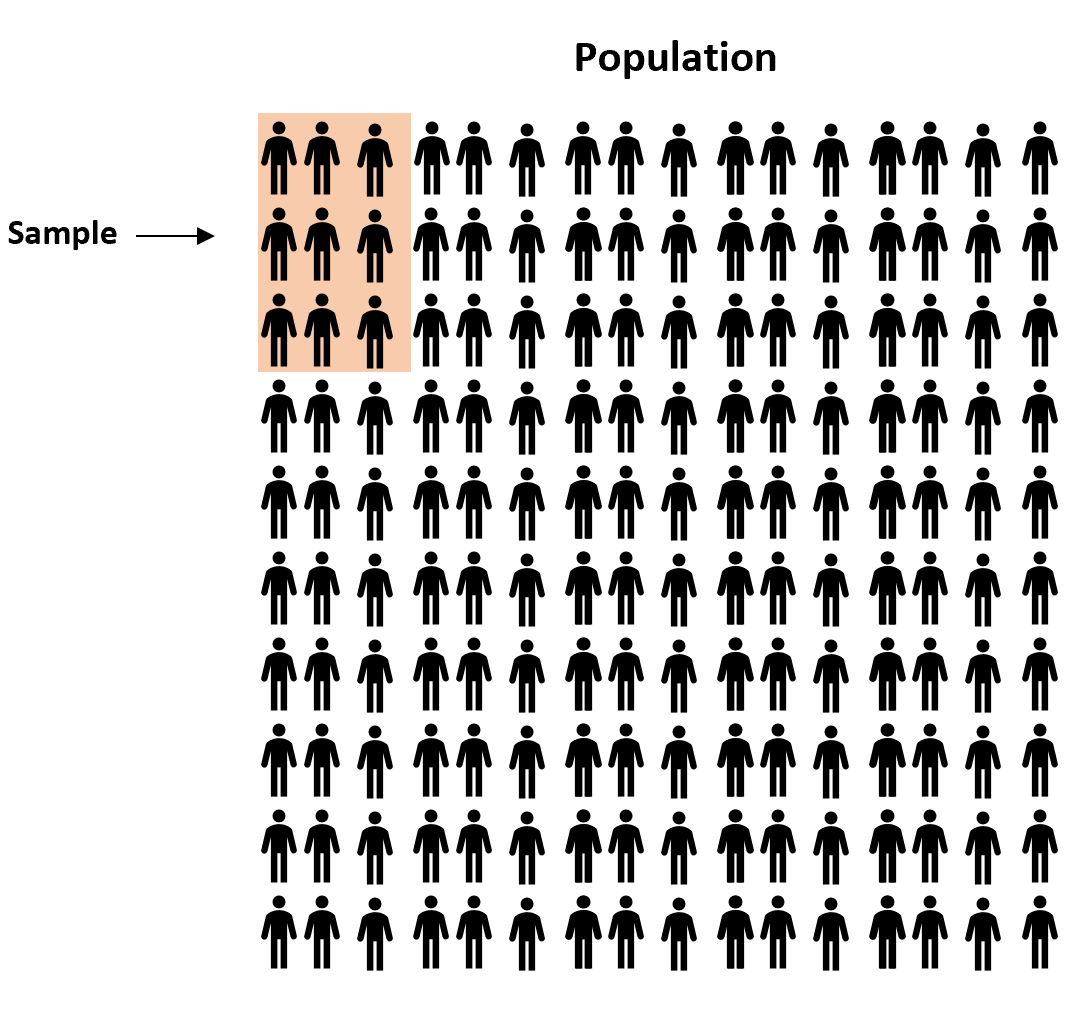
However, it’s virtually guaranteed that the proportion of residents in the sample who support the law will be at least a little different from the proportion of residents in the entire population who support the law. The question is whether or not this difference is statistically significant. Fortunately, a one proportion z-test allows us to answer this question.
One Proportion Z-Test: Formula
A one proportion z-test always uses the following null hypothesis:
- H0: p = p0 (population proportion is equal to some hypothesized population proportion p0)
The alternative hypothesis can be either two-tailed, left-tailed, or right-tailed:
- H1 (two-tailed): p ≠ p0 (population proportion is not equal to some hypothesized value p0)
- H1 (left-tailed): p 0 (population proportion is less than some hypothesized value p0)
- H1 (right-tailed): p > p0 (population proportion is greater than some hypothesized value p0)
We use the following formula to calculate the test statistic z:
z = (p-p0) / √p0(1-p0)/n
where:
- p: observed sample proportion
- p0: hypothesized population proportion
- n: sample size
If the p-value that corresponds to the test statistic z is less than your chosen significance level (common choices are 0.10, 0.05, and 0.01) then you can reject the null hypothesis.
One Proportion Z-Test: Example
Suppose we want to know whether or not the proportion of residents in a certain county who support a certain law is equal to 60%. To test this, will perform a one proportion z-test at significance level α = 0.05 using the following steps:
Step 1: Gather the sample data.
Suppose we survey a random sample of residents and end up with the following information:
- p: observed sample proportion = 0.64
- p0: hypothesized population proportion = 0.60
- n: sample size = 100
Step 2: Define the hypotheses.
We will perform the one sample t-test with the following hypotheses:
- H0: p = 0.60 (population proportion is equal to 0.60)
- H1: p ≠ 0.60 (population proportion is not equal to 0.60)
Step 3: Calculate the test statistic z.
z = (p-p0) / √p0(1-p0)/n = (.64-.6) / √.6(1-.6)/100 = 0.816
Step 4: Calculate the p-value of the test statistic z.
According to the Z Score to P Value Calculator, the two-tailed p-value associated with z = 0.816 is 0.4145.
Step 5: Draw a conclusion.
Since this p-value is not less than our significance level α = 0.05, we fail to reject the null hypothesis. We do not have sufficient evidence to say that the proportion of residents who support the law is different from 0.60.
Note: You can also perform this entire one proportion z-test by simply using the One Proportion Z-Test Calculator.
Additional Resources
How to Perform a One Proportion Z-Test in Excel
One Proportion Z-Test Calculator