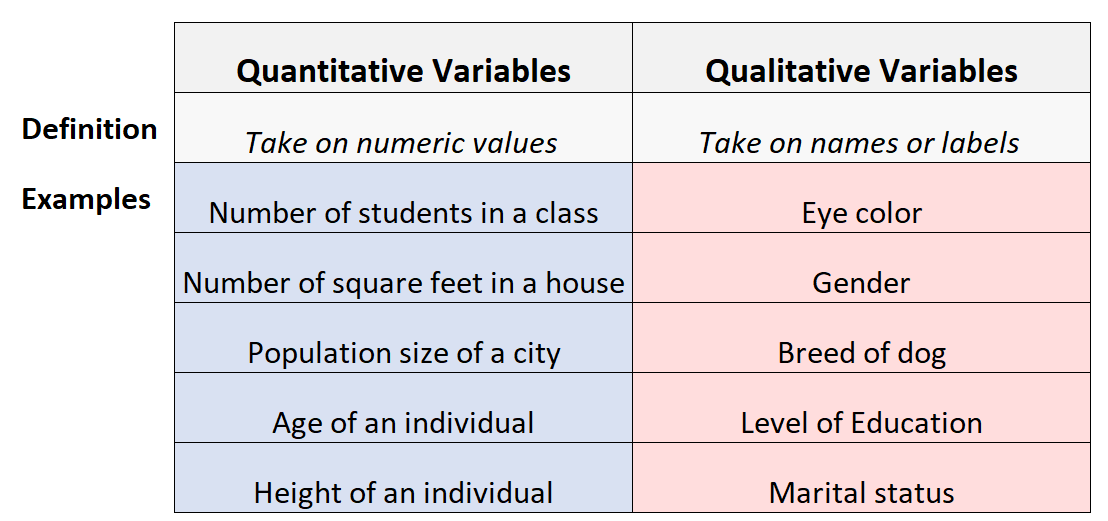
In statistics, there are two types of variables:
1. Quantitative Variables: Sometimes referred to as “numeric” variables, these are variables that represent a measurable quantity. Examples include:
- Number of students in a class
- Number of square feet in a house
- Population size of a city
- Age of an individual
- Height of an individual
2. Qualitative Variables: Sometimes referred to as “categorical” variables, these are variables that take on names or labels and can fit into categories. Examples include:
- Eye color (e.g. “blue”, “green”, “brown”)
- Gender (e.g. “male”, “female”)
- Breed of dog (e.g. “lab”, “bulldog”, “poodle”)
- Level of education (e.g. “high school”, “Associate’s degree”, “Bachelor’s degree”)
- Marital status (e.g. “married”, “single”, “divorced”)
Every single variable you will ever encounter in statistics can be classified as either quantitative or qualitative.
Example: Classifying Quantitative & Qualitative Variables
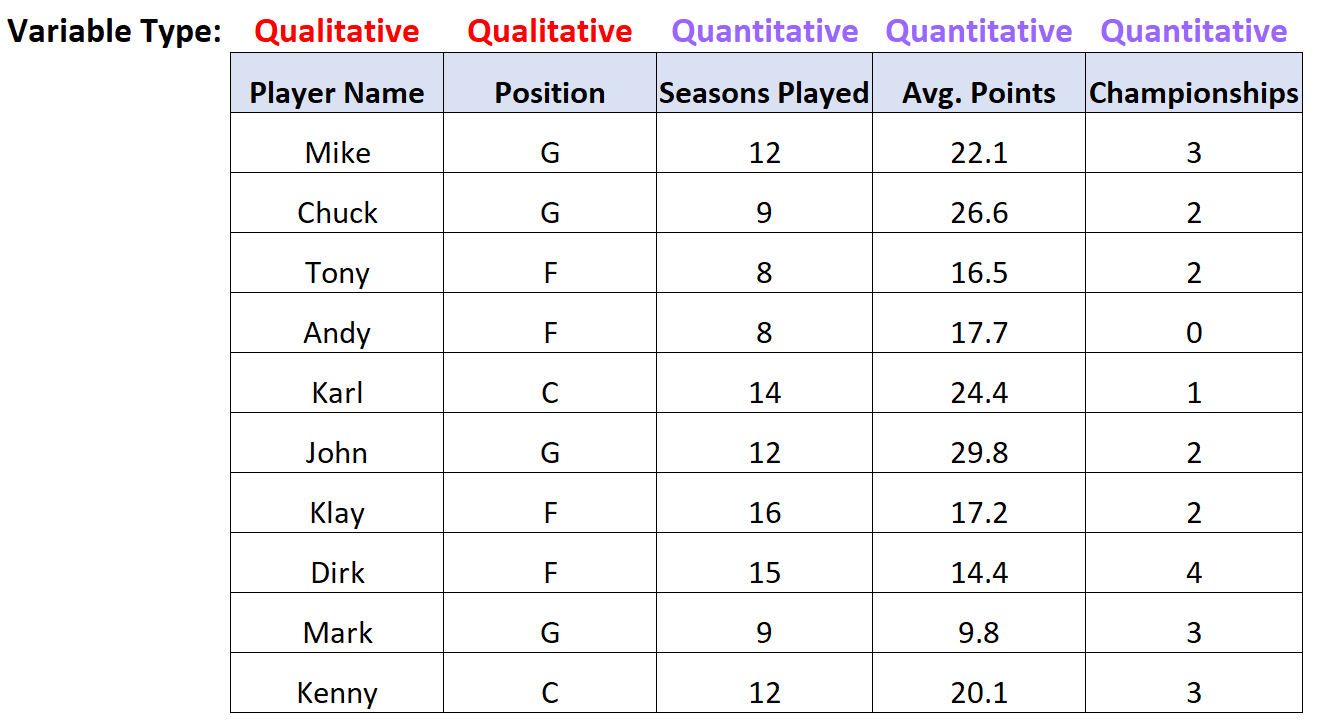
Consider the following dataset with information about 10 different basketball players:

There are five total variables in this dataset. Two of them are qualitative variables and three of them are quantitative variables:
Summarizing Quantitative & Qualitative Variables
We can use many different metrics to summarize quantitative variables, including:
- Measures of central tendency like the mean, median, and mode.
- Measures of dispersion like the range, interquartile range, and standard deviation.
However, we can only use frequency tables and relative frequency tables to summarize qualitative variables.
To illustrate this, let’s once again consider the dataset from the previous example:
For the quantiative variable Seasons Played, we can calculate the following metrics:
- Mean: 11.5
- Median: 12
- Mode: 12
- Range: 8
- Interquartile Range: 4.5
- Standard Deviation: 2.915
These metrics give us a good idea of where the center value is located as well as how spread out the values are for this variable.
And for the qualitative variable Position, we can create a frequency table to describe how often different values occur:

This table lets us quickly see how frequently each position (G=guard, F=forward, C=center) occurred in the dataset.
Additional Resources
Descriptive vs. Inferential Statistics
Statistic vs. Parameter
Levels of Measurement: Nominal, Ordinal, Interval and Ratio