A histogram offers a useful way to visualize the distribution of values in a dataset.
The x-axis of a histogram displays bins of data values and the y-axis tells us how many observations in a dataset fall in each bin.
Since a histogram places observations in bins, it’s not possible to calculate the exact standard deviation of the dataset represented by the histogram but it’s possible to estimate the standard deviation.
The following example shows how to do so.
Related: How to Estimate the Mean and Median of Any Histogram
How to Estimate the Standard Deviation of a Histogram
In order to estimate the standard deviation of a histogram, we must first estimate the mean.
We can use the following formula to estimate the mean:
Mean: Σmini / N
where:
- mi: The midpoint of the ith bin
- ni: The frequency of the ith bin
- N: The total sample size
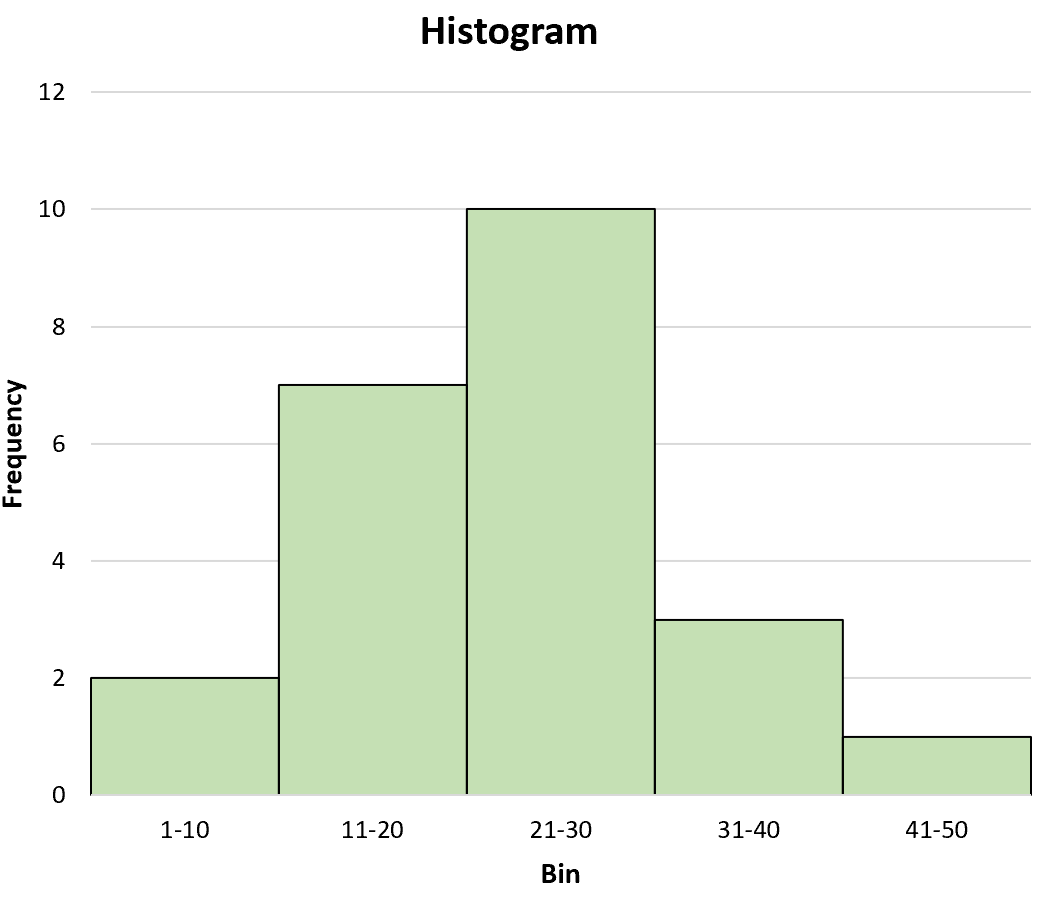
For example, suppose we have the following histogram:
Here’s how we would estimate the mean value of this histogram:
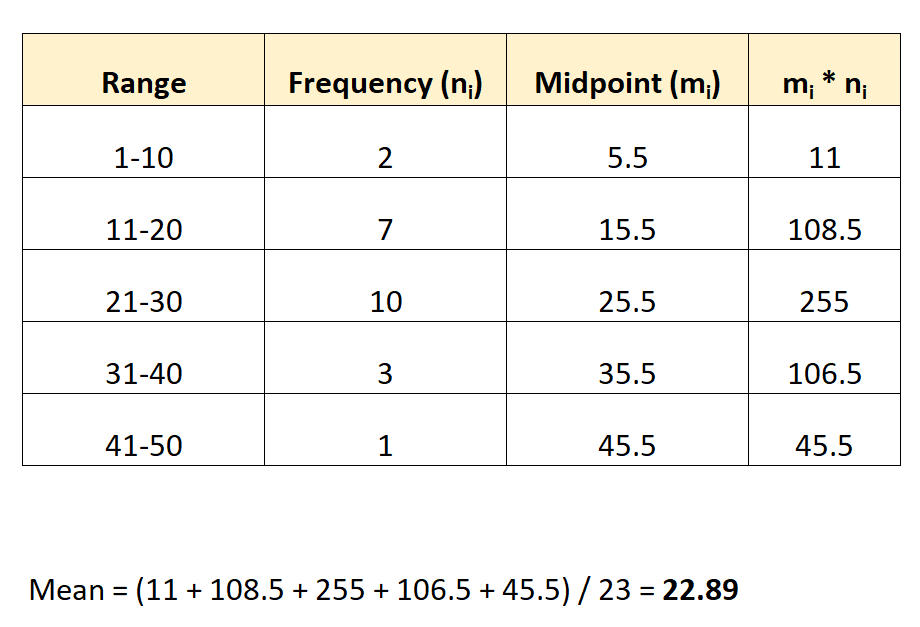
We estimate the mean to be 22.89.
Note: The midpoint for each group can be found by taking the average of the lower and upper value in the range. For example, the midpoint for the first group is calculated as: (1+10) / 2 = 5.5.
Now that we have an estimate for the mean, we can use the following formula to estimate the standard deviation:
Standard Deviation: √Σni(mi-μ)2 / (N-1)
where:
- ni: The frequency of the ith bin
- mi: The midpoint of the ith bin
- μ: The mean
- N: The total sample size
Here’s how we would apply this formula to our dataset:
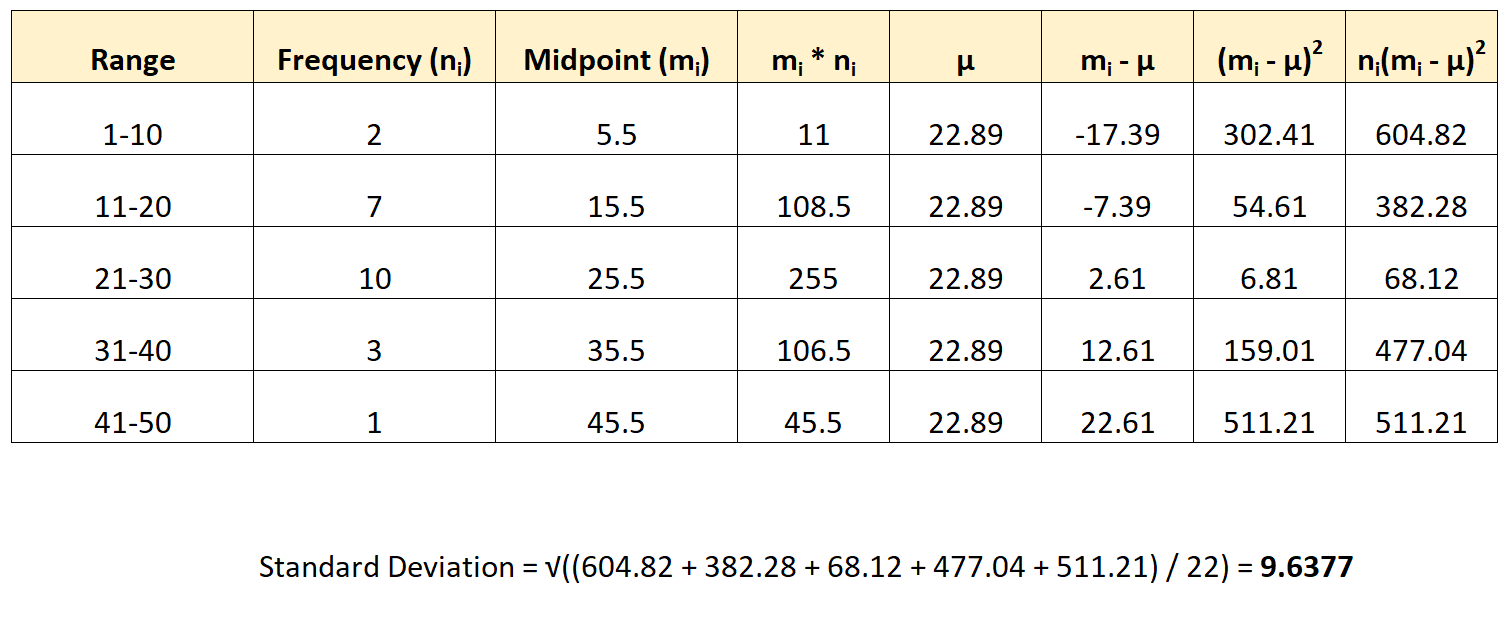 We estimate that the standard deviation of the dataset is 9.6377.
Although this isn’t guaranteed to match the exact standard deviation of the dataset (since we don’t know the raw data values of the dataset), it represents our best estimate of the standard deviation.
Additional Resources
The following tutorials explain how to perform other common tasks related to data grouped into bins:
How to Find the Variance of Grouped Data
How to Find the Median of Grouped Data
How to Find the Mode of Grouped Data