The F distribution table is a table that shows the critical values of the F distribution. To use the F distribution table, you only need three values:
- The numerator degrees of freedom
- The denominator degrees of freedom
- The alpha level
The F distribution is used most commonly in an Analysis of Variance, or ANOVA for short. For example, here is what the output table for an ANOVA might look like:
| Source | SS | df | MS | F | P |
|---|---|---|---|---|---|
| Treatment | 58.8 | 2 | 29.4 | 1.74 | 0.217 |
| Error | 202.8 | 12 | 16.9 | ||
| Total | 261.6 | 14 |
In this example, the numerator degrees of freedom for the F statistic is 2, the denominator degrees of freedom for the F statistic is 12, and the F statistic itself is 1.74. Suppose the alpha level we are using is 0.10. In the table above, we see that the p-value for this F statistic is 0.217. Since 0.217 is greater than the alpha level, we would conclude that this F statistic is not statistically significant.
If we instead wanted to use the F Distribution Table, we would use the F Distribution Table for alpha = 0.10. We would locate the critical value in the table that corresponds to a numerator degrees of freedom of 2 (DF1 = 2 in the table) and a denominator degrees of freedom of 12 (DF2 = 12 in the table) and find that this value is 2.8068.
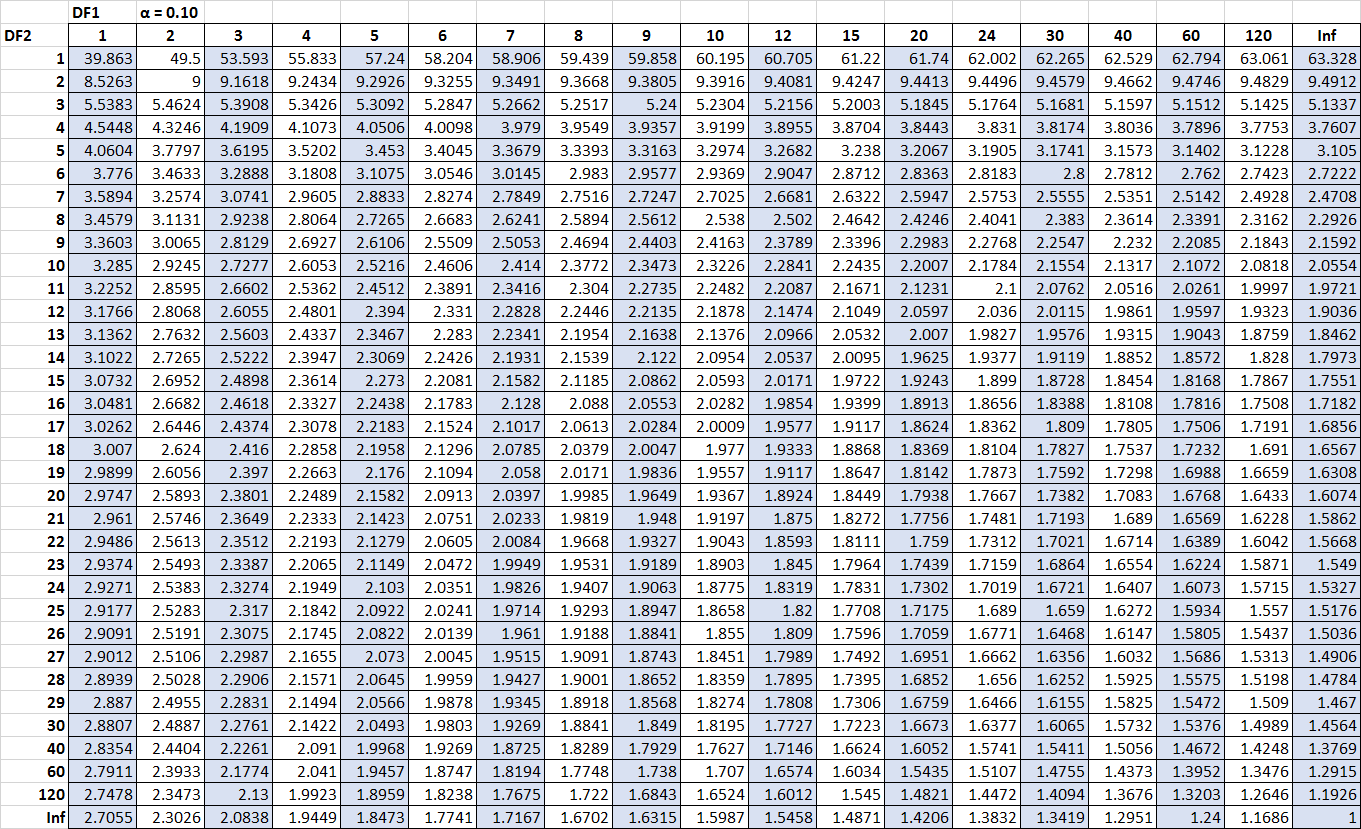
Since our F statistic of 1.74 from the ANOVA table is not greater than the F critical value of 2.8068 from the F Distribution table, we would conclude that the F statistic is not significant at the alpha level of 0.10.
The F Distribution Table Provides Critical Values, Not P-Values
Notice in the example above that the F Distribution Table simply gives us an F critical value to compare our F statistic to. The F Distribution Table does not directly give us a p-value.
If you have an F statistic with a numerator degrees of freedom and denominator degrees of freedom and you would like to find the p-value for it, then you would need to use an F Distribution Calculator.
For example, suppose we knew that our F statistic was 1.74, the numerator degrees of freedom was 2, and the denominator degrees of freedom was 12 and we wanted to find the p-value for this F statistic. In this case, we would enter the following numbers into the F Distribution Calculator:
Note: Leave the last box blank. The calculator will automatically find this value for you.
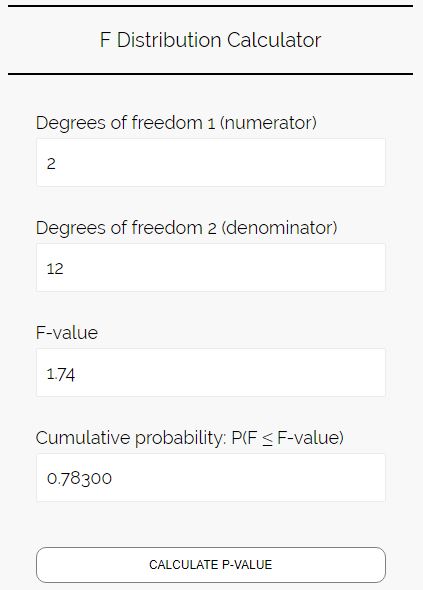
This tells us that the cumulative probability is 0.78300. This is the area to the left of the F statistic in the F distribution. Typically we’re interested in the area to the right of the F statistic, so in this case the p-value would be 1 – 0.78300 = 0.217.
When to Use the F Distribution Table
If you are interested in finding the F critical value for a given numerator degrees of freedom, denominator degrees of freedom, and alpha level, then you should use the F distribution table.
Instead, if you have a given F statistic (from an ANOVA or some other statistical test) with a given numerator degrees of freedom and denominator degrees of freedom and you simply want to know the p-value of that F statistic, then you would need to use an F Distribution Calculator to do so.