A five number summary is a way to summarize a dataset using the following five values:
- The minimum
- The first quartile
- The median
- The third quartile
- The maximum
The five number summary is useful because it provides a concise summary of the distribution of the data in the following ways:
- It tells us where the middle value is located, using the median.
- It tells us how spread out the data is, using the first and third quartiles.
- It tells us the range of the data, using the minimum and the maximum.
This tutorial explains how to quickly calculate a five number summary for a dataset in SPSS.
Example: Five Number Summary in SPSS
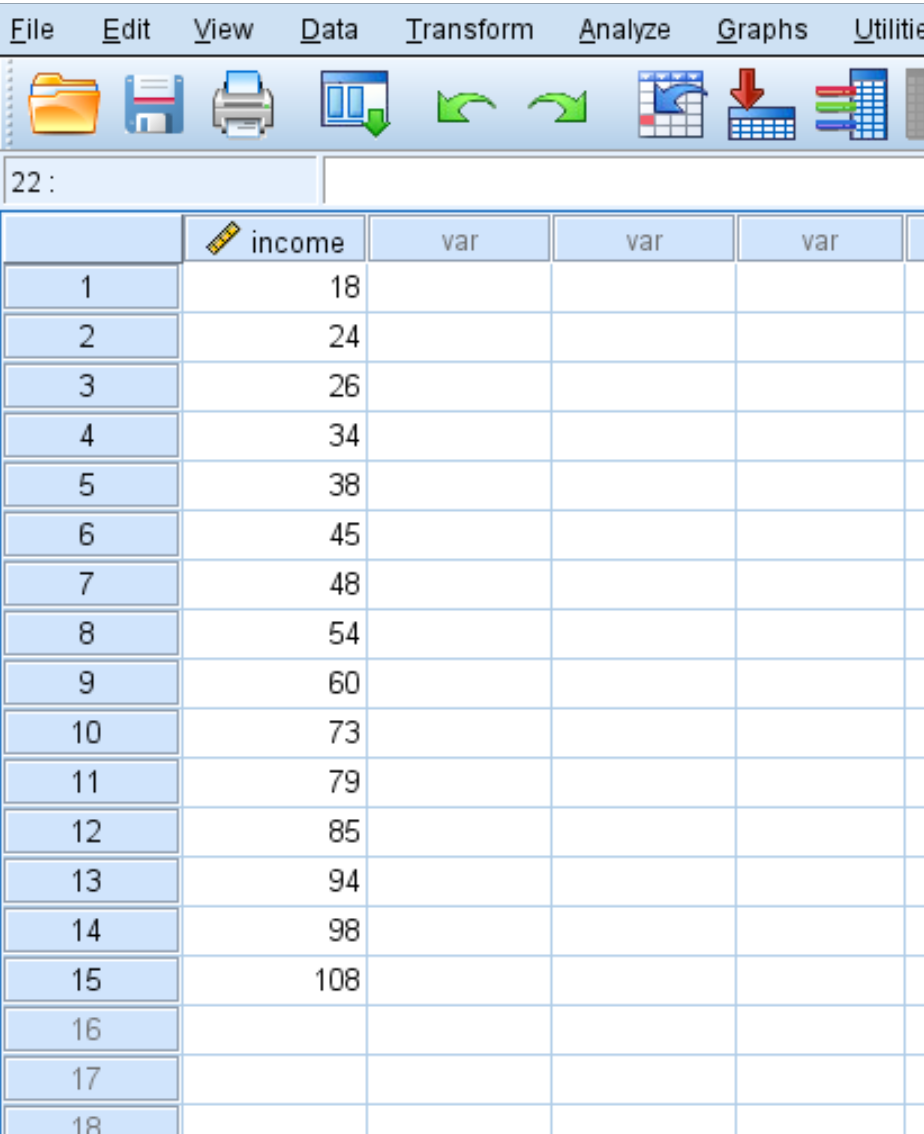
Suppose we have the following dataset in SPSS that displays the annual income (in thousands) of 15 individuals:
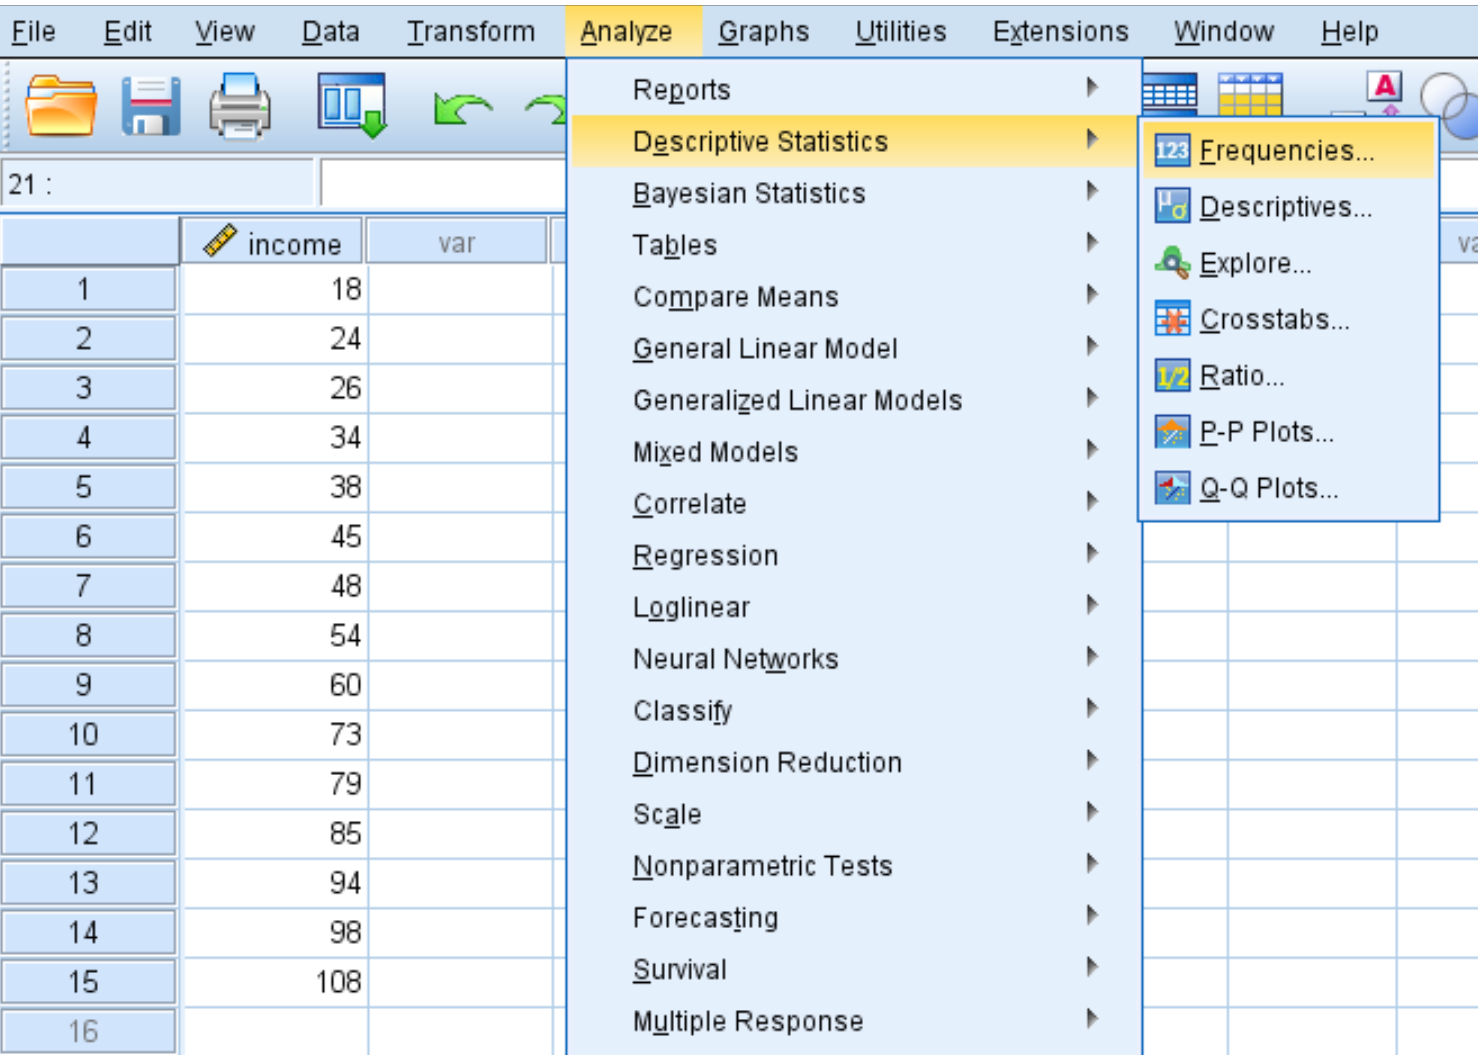
To calculate the five number summary for this dataset, click the Analyze tab, then Descriptive Statistics, then Frequencies:
In the new window that pops up, drag the variable income into the box labelled Variable(s).
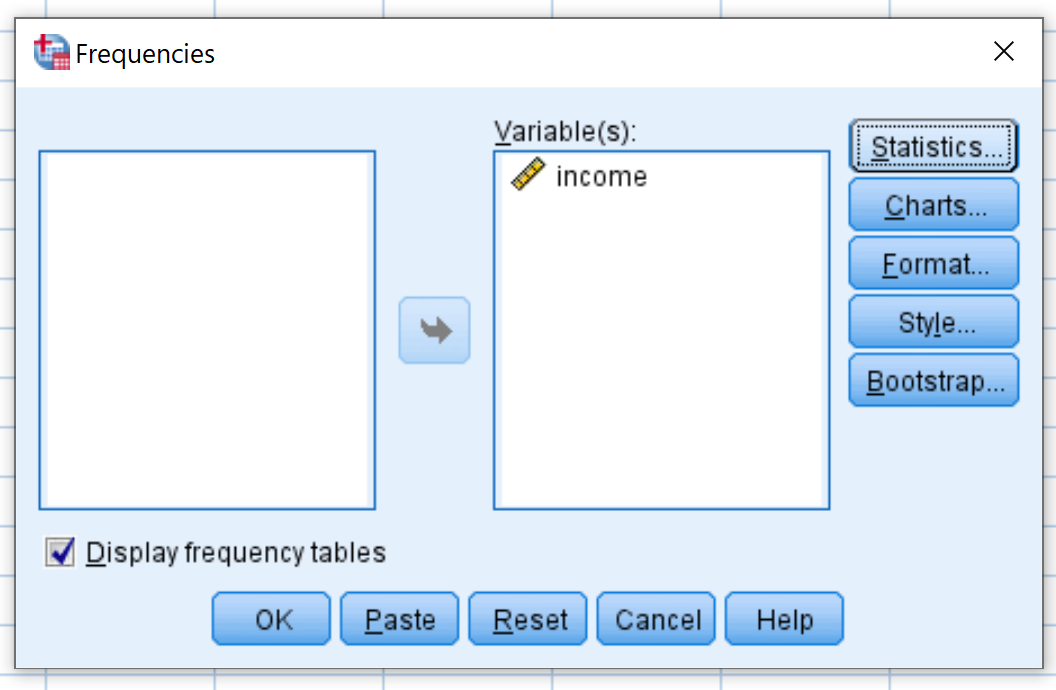
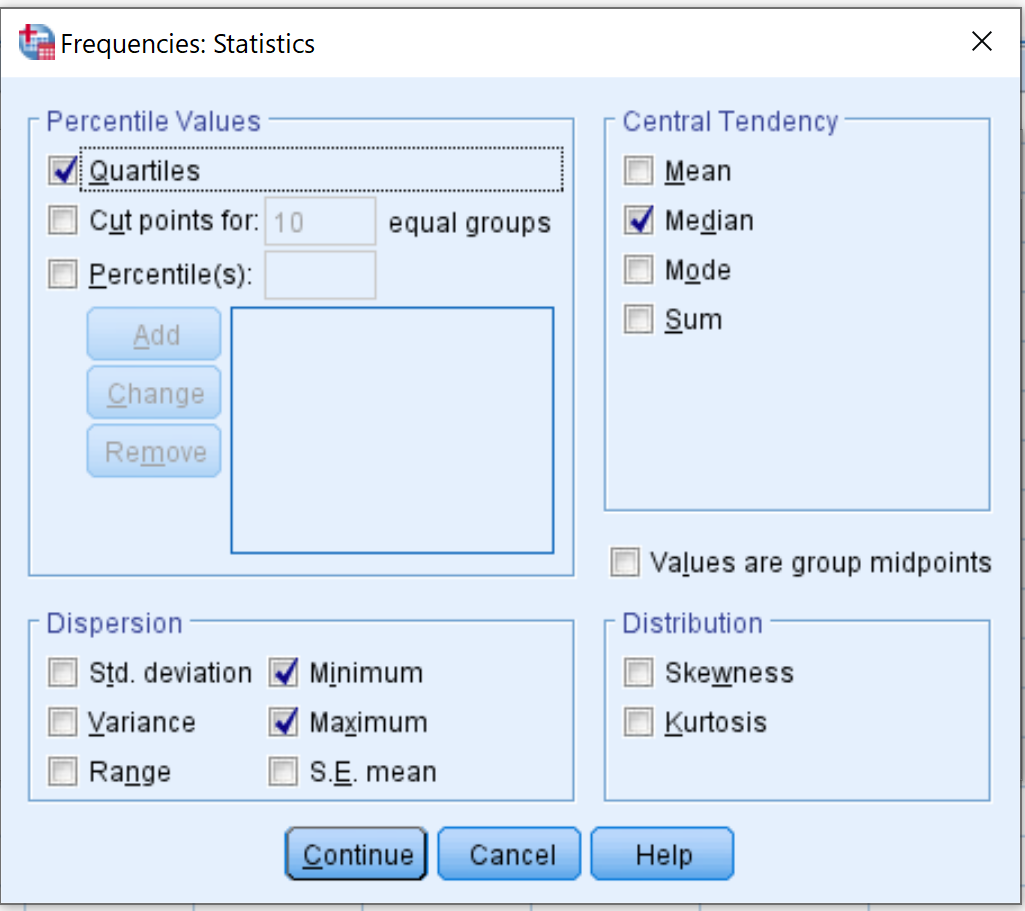
Next, click the Statistics button. Make sure each of the following boxes is checked:
- Quartiles
- Minimum
- Maximum
- Median
Then click Continue.
Then click OK. The five number summary results will appear:
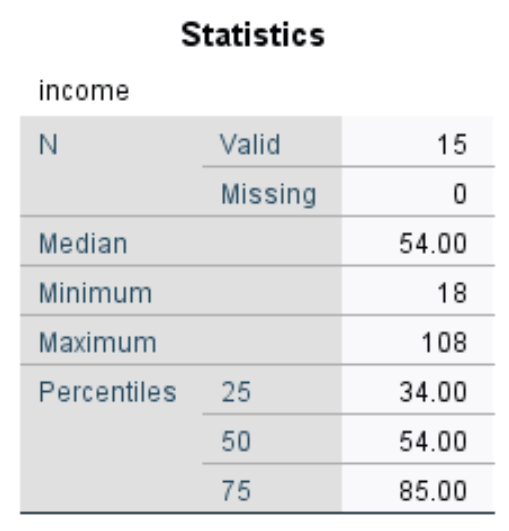
From the results we can see the five number summary for this dataset is as follows:
- The minimum: 18
- The first quartile: 34.00
- The median: 54.00
- The third quartile: 85.00
- The maximum: 108
Additional Resources
Five Number Summary Calculator
How to Calculate a Five Number Summary in Excel