The Friedman Test is a non-parametric alternative to the Repeated Measures ANOVA.
It is used to determine whether or not there is a statistically significant difference between the means of three or more groups in which the same subjects show up in each group.
When to Use the Friedman Test
The Friedman Test is commonly used in two situations:
1. Measuring the mean scores of subjects during three or more time points.
For example, you might want to measure the resting heart rate of subjects one month before they start a training program, one month after starting the program, and two months after using the program. You can perform the Friedman Test to see if there is a significant difference in the mean resting heart rate of patients across these three time points.
2. Measuring the mean scores of subjects under three different conditions.
For example, you might have subjects watch three different movies and rate each one based on how much they enjoyed it. Since each subject shows up in each sample, you can perform a Friedman Test to see if there is a significant difference in the mean rating of the three movies.
Friedman Test: Example
Suppose we want to know if the mean reaction time of subjects is different on three different drugs. To test this, we recruit 10 patients and measure each of their reaction times (in seconds) on the three different drugs. The results for each patient are shown below:
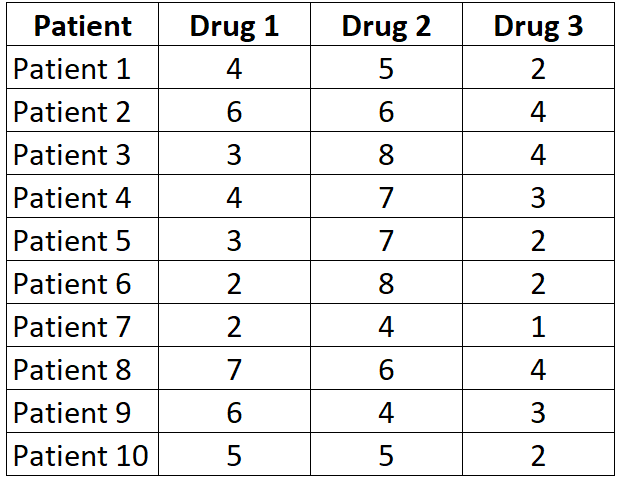
Since each patient is measured on each of the three drugs, we will use the Friedman Test to determine if the mean reaction time differs between the three drugs.
Step 1. State the hypotheses.
The null hypothesis (H0): µ1 = µ2 = µ3 (the mean reaction times across the populations are all equal)
The alternative hypothesis: (Ha): at least one population mean is different from the rest
Step 2. Perform the Friedman Test.
We will use the Friedman Test Calculator using the following input:

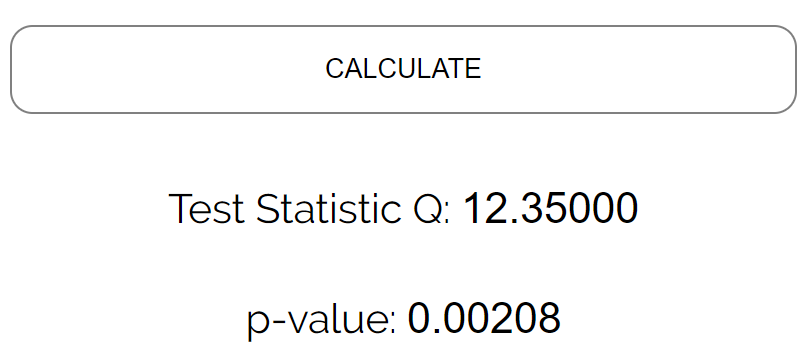
Once we click “Calculate” then the following output will automatically appear:
Step 3: Interpret the results.
The test statistic is Q = 12.35 and the corresponding p-value is p = 0.00208. Since this value is less than 0.05, we can reject the null hypothesis that the mean response time is the same for all three drugs.
We have sufficient evidence to conclude that the type of drug used leads to statistically significant differences in response time.
Step 4: Report the results.
Lastly, we want to report the results of the test. Here is an example of how to do so:
A Friedman Test was conducted on 10 patients to examine the effect that three different drugs had on response time. Each patient used each drug once.
Results showed that the type of drug used lead to statistically significant differences in response time (Q = 12.35, p = 0.00208).
Additional Resources
The following tutorials explain how to perform the Friedman Test using different statistical softwares:
How to Perform the Friedman Test in Excel
How to Perform the Friedman Test in R
How to Perform the Friedman Test in Python
How to Perform the Friedman Test in Stata
Online Friedman Test Calculator