You can use the microbenchmark package in R to compare the execution time of different expressions.
You can use the following syntax to do so:
library(microbenchmark)

#compare execution time of two different expressions
microbenchmark(
  expression1,
  expression2)
)
The following example shows how to use this syntax in practice.
Example: Using microbenchmark() in R
Suppose we have the following data frame in R that contains information about points scored by players on various basketball teams:
#make this example reproducible
set.seed(1)

#create data frame
df frame(team=rep(c('A', 'B'), each=500),
                 points=rnorm(1000, mean=20))

#view data frame
head(df)

  team   points
1    A 19.37355
2    A 20.18364
3    A 19.16437
4    A 21.59528
5    A 20.32951
6    A 19.17953
Now suppose we would like to calculate the mean points scored by players on each team using two different methods:
- Method 1: Use aggregate() from Base R
- Method 2: Use group_by() and summarise_at() from dplyr
We can use the microbenchmark() function to measure how long it takes for each of these expressions to execute:
library(microbenchmark)
library(dplyr)

#time how long it takes to calculate mean value of points by team
microbenchmark(
  aggregate(df$points, list(df$team), FUN=mean),
  df %>% group_by(team) %>% summarise_at(vars(points), list(name = mean))
)

Unit: milliseconds
                                                                    expr
                         aggregate(df$points, list(df$team), FUN = mean)
 df %>% group_by(team) %>% summarise_at(vars(points), list(name = mean))
      min       lq     mean   median        uq      max neval cld
 1.307908 1.524078 1.852167 1.743568  2.093813  4.67408   100  a
 6.788584 7.810932 9.946286 8.914692 10.239904 56.20928   100   b
The microbenchmark() function executes each expression 100 times and measures the following metrics:
- min: Minimum time it took to execute
- lq: Lower quartile (25th percentile) time it took to execute
- mean: Mean time it took to execute
- median: Median time it took to execute
- uq: Upper quartile (75th percentile) time it took to execute
- max: Maximum time it took to execute
- neval: Number of times each expression was evaluated
Typically we only look at either the mean or median time it took to execute each expression.
From the output we can see:
- It took a mean time of 1.852 milliseconds to calculate the mean points by team using the base R method.
- It took a mean time of 9.946 milliseconds to calculate the mean points by team using the dplyr method.
Based on these results, we would conclude that the base R method is significantly faster.
We can also use the boxplot() function to visualize the distribution of times it took to execute each expression:
library(microbenchmark)
library(dplyr)

#time how long it takes to calculate mean value of points by team
results % group_by(team) %>% summarise_at(vars(points), list(name = mean))
)

#create boxplot to visualize results
boxplot(results, names=c('Base R', 'dplyr'))
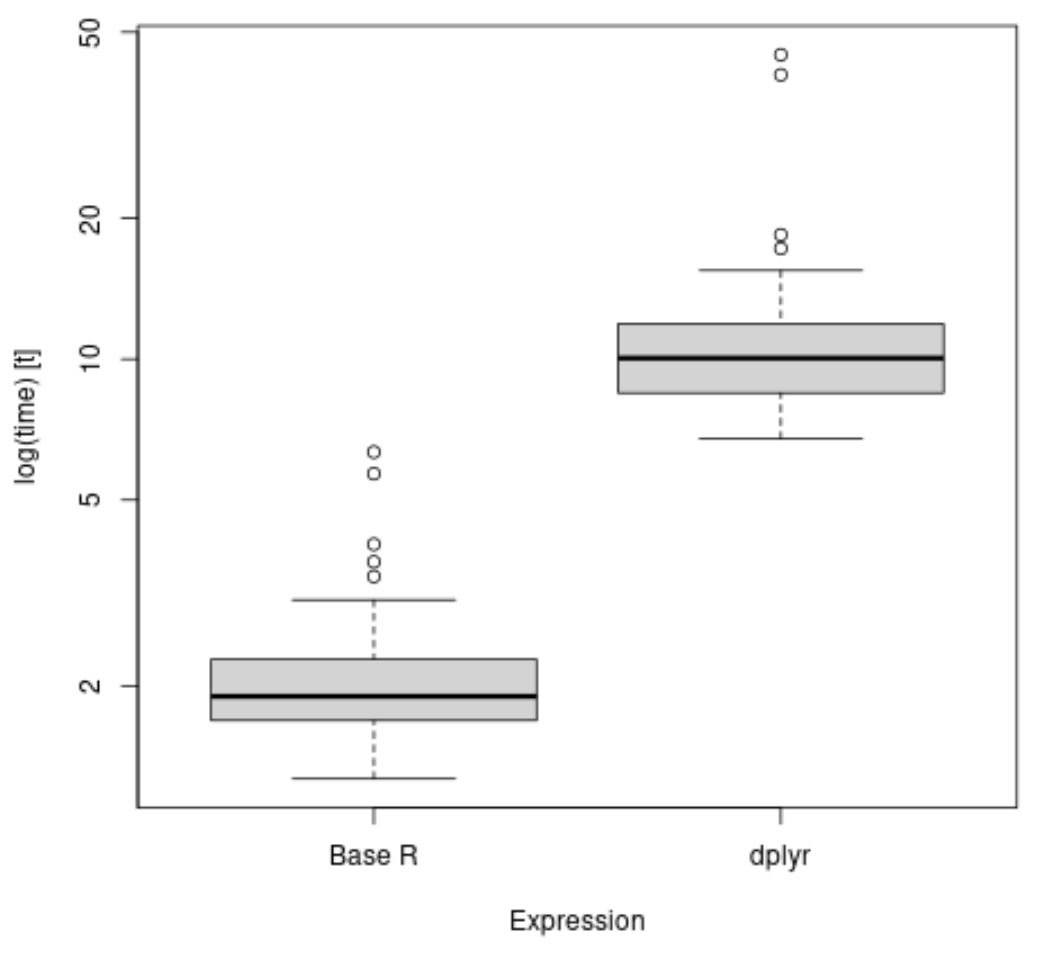
From the boxplots we can see that the dplyr method takes longer, on average, to calculate the mean points value by team.
Note: In this example we used the microbenchmark() function to compare the execution time of two different expressions, but you can compare as many expressions as you’d like in practice.
Additional Resources
The following tutorials explain how to perform other common tasks in R:
How to Clear the Environment in R
How to Clear All Plots in RStudio
How to Load Multiple Packages in R