Levene’s Test is used to determine whether two or more groups have equal variances. This is a widely used test in statistics because many statistical tests use the assumption that groups have equal variances.
This tutorial explains how to perform Levene’s Test in Stata.
Example: Levene’s Test in Stata
For this example we will use the dataset stay, which contains information about the length of stay for 1,778 different patients hospitalized for a given medical procedure differs by gender. The dataset contains 884 males and 894 females.
Use the following steps to perform Levene’s Test to determine if the variances in length of stay is equal for males and females.
Step 1: Load and view the data.
Use the following command to load the dataset in Stata.
use http://www.stata-press.com/data/r13/stay
View the first ten rows of data using the following command:
list in 1/10
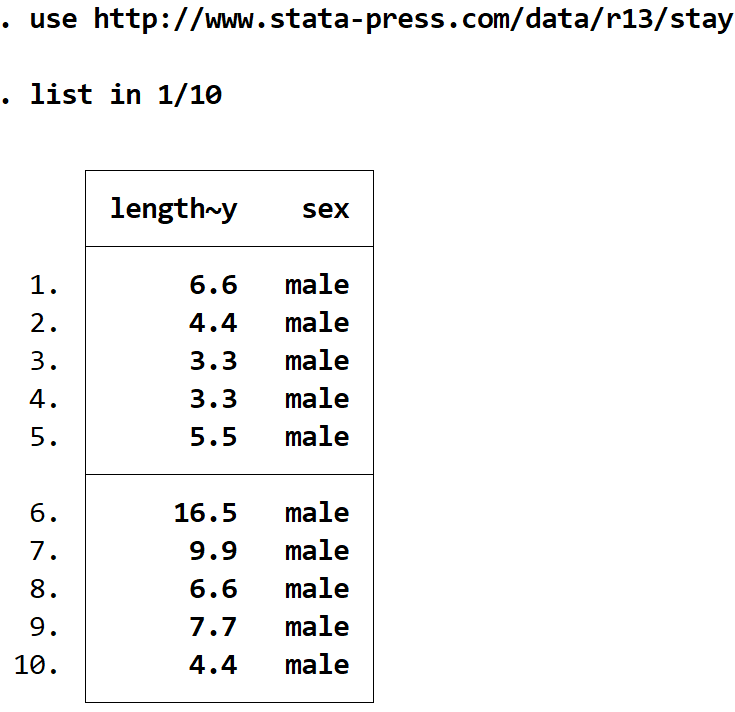
The first column displays the length of stay (in days) for an individual and the second column displays the sex of the individual.
Step 2: Perform Levene’s Test.
We will use the following syntax to perform Levene’s Test:
robvar measurement_variable, by(grouping_variable)
In our case we will use the following syntax:
robvar lengthstay, by(sex)
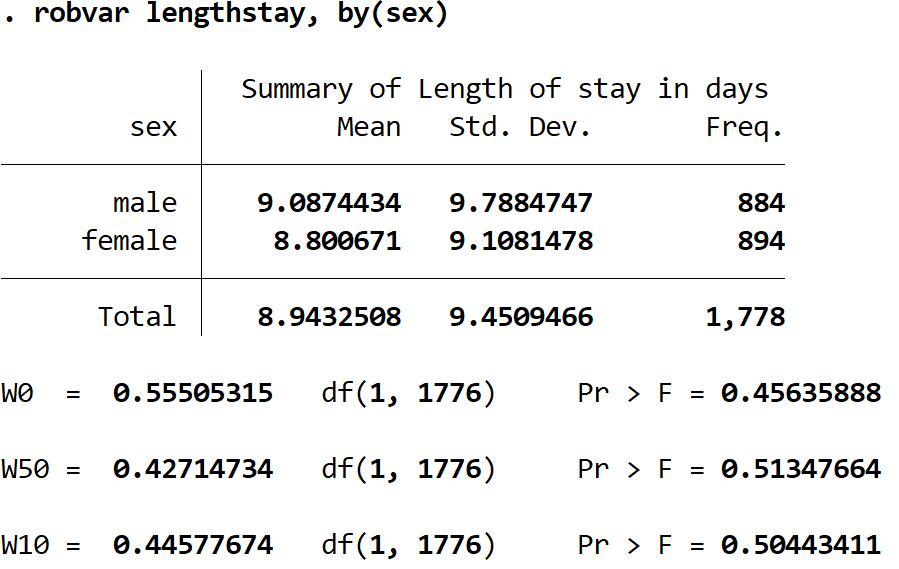
Here is how to interpret the output:
Summary table: This table shows the mean length of stay, standard deviation in length of stay, and total observations for both males and females. We can see that the standard deviation in length of stay is higher for males (9.7884747) compared to females (9.1081478), but Levene’s Test will tell us whether or not this difference is statistically significant.
W0: 0.55505315. This is the test statistic for Levene’s Test centered at the mean. The corresponding p-value is 0.45625888.
W50: 0.42714734. This is the test statistic for Levene’s Test centered at the median. The corresponding p-value is 0.51347664.
W10: 0.44577674. This is the test statistic for Levene’s Test centered using the 10% trimmed mean – i.e. the top 5% and bottom 5% of values are trimmed out so they don’t overly influence the test. The corresponding p-value is 0.50443411.
No matter which version of Levene’s Test you use, the p-value for each version is not less than 0.05. This indicates that there is not a statistically significant difference in the variance of length of stay between males and females.
Note: Conover, Johnson, and Johnson (1981) recommend using the median test for assymetric data because it tends to provide more accurate results. For symmetric data, the median test and the mean test will produce similar results.