A confidence interval for a mean is a range of values that is likely to contain a population mean with a certain level of confidence.
This tutorial explains the following:
- The motivation for creating a confidence interval for a mean.
- The formula to create a confidence interval for a mean.
- An example of how to calculate a confidence interval for a mean.
- How to interpret a confidence interval for a mean.
Confidence Interval for a Mean: Motivation
The reason that we would even want to create a confidence interval for a mean is because we want to capture our uncertainty when estimating a population mean.
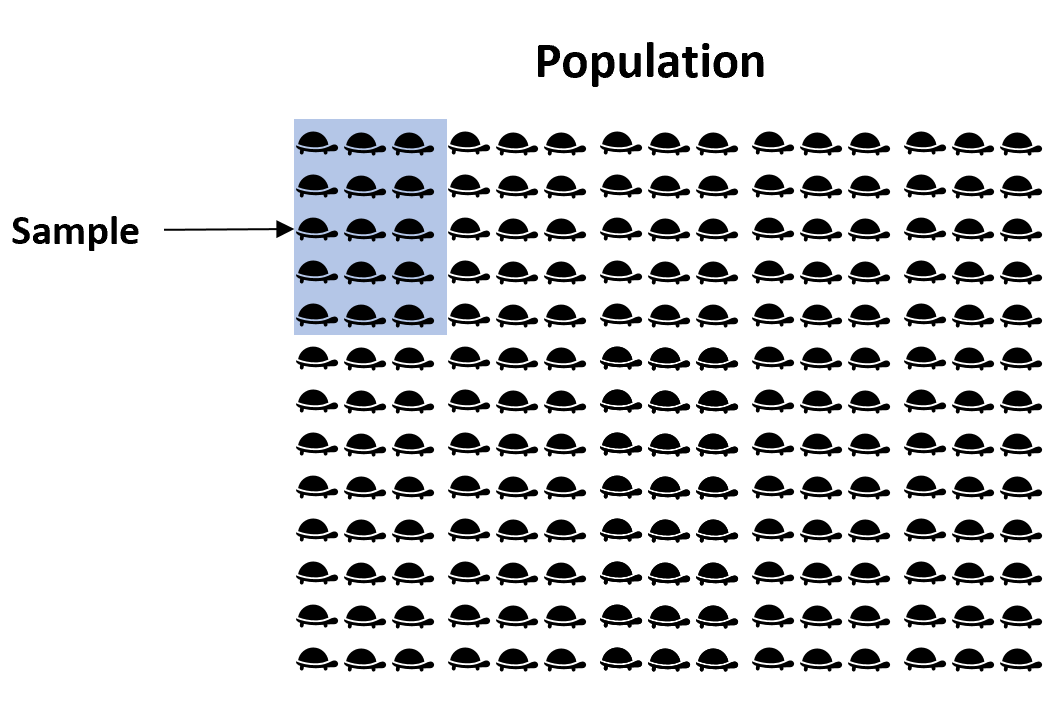
For example, suppose we want to estimate the mean weight of a certain species of turtle in Florida. Since there are thousands of turtles in Florida, it would be extremely time-consuming and costly to go around and weigh each individual turtle.
Instead, we might take a simple random sample of 50 turtles and use the mean weight of the turtles in this sample to estimate the true population mean:
The problem is that the mean weight in the sample is not guaranteed to exactly match the mean weight of the whole population. So, to capture this uncertainty we can create a confidence interval that contains a range of values that are likely to contain the true mean weight of the turtles in the population.
Confidence Interval for a Mean: Formula
We use the following formula to calculate a confidence interval for a mean:
Confidence Interval = x +/- z*(s/√n)
where:
- x: sample mean
- z: the chosen z-value
- s: sample standard deviation
- n: sample size
The z-value that you will use is dependent on the confidence level that you choose. The following table shows the z-value that corresponds to popular confidence level choices:
| Confidence Level | z-value |
|---|---|
| 0.90 | 1.645 |
| 0.95 | 1.96 |
| 0.99 | 2.58 |
Notice that higher confidence levels correspond to larger z-values, which leads to wider confidence intervals. This means that, for example, a 99% confidence interval will be wider than a 95% confidence interval for the same set of data.
Confidence Interval for a Mean: Example
Suppose we collect a random sample of turtles with the following information:
- Sample size n = 25
- Sample mean weight x = 300
- Sample standard deviation s = 18.5
Here is how to find various confidence intervals for the true population mean weight:
90% Confidence Interval: 300 +/- 1.645*(18.5/√25) = [293.91, 306.09]
95% Confidence Interval: 300 +/- 1.96*(18.5/√25) = [292.75, 307.25]
99% Confidence Interval: 300 +/- 2.58*(18.5/√25) = [290.47, 309.53]
Note: You can also find these confidence intervals by using the Statology Confidence Interval Calculator.
Confidence Interval for a Mean: Interpretation
The way we would interpret a confidence interval is as follows:
There is a 95% chance that the confidence interval of [292.75, 307.25] contains the true population mean weight of turtles.
Another way of saying the same thing is that there is only a 5% chance that the true population mean lies outside of the 95% confidence interval. That is, there’s only a 5% chance that the true population mean weight of turtles is greater than 307.25 pounds or less than 292.75 pounds.