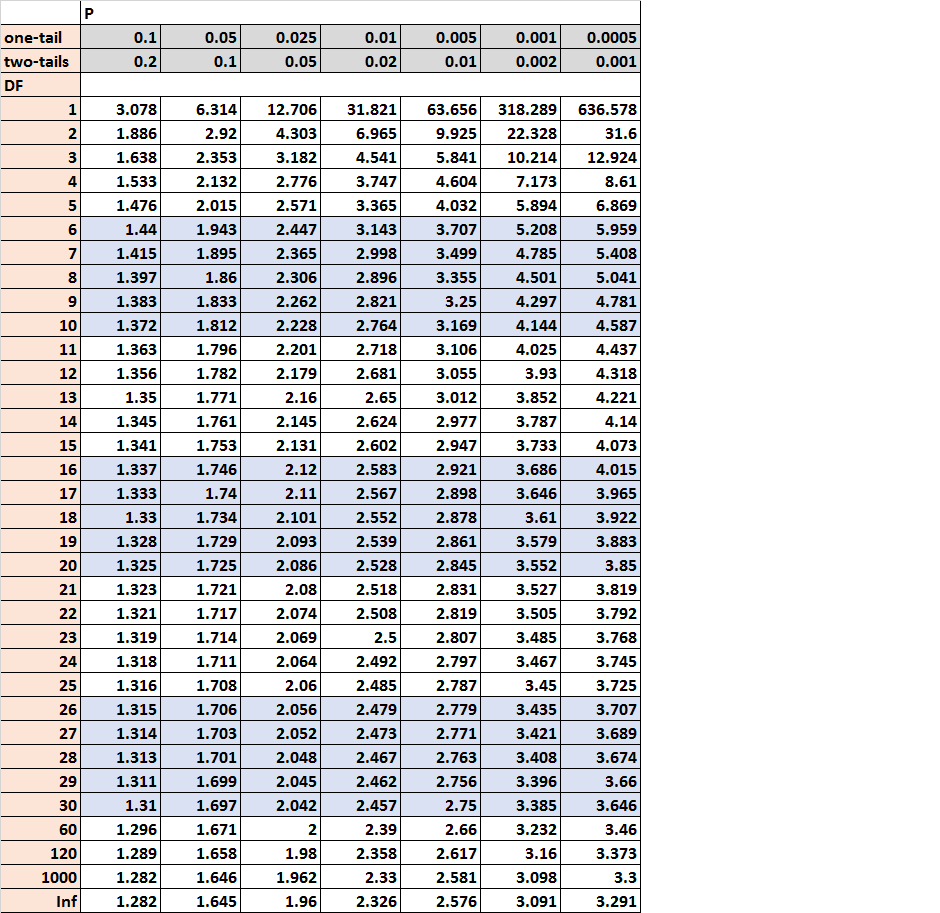
The t distribution table is a table that shows the critical values of the t distribution. To use the t distribution table, you only need three values:
- A significance level (common choices are 0.01, 0.05, and 0.10)
- The degrees of freedom
- The type of test (one-tailed or two-tailed)
The t distribution table is commonly used in the following hypothesis tests:
- A hypothesis test for a mean
- A hypothesis test for a difference in means
- A hypothesis test for a difference in paired means
When you conduct each of these tests, you’ll end up with a test statistic t. To find out if this test statistic is statistically significant at some alpha level, you have two options:
- Compare the test statistic t to a critical value from the t distribution table.
- Compare the p-value of the test statistic t to a chosen alpha level.
Let’s walk through an example of how to use each of these approaches.
Examples
Suppose we conduct a two-sided hypothesis test at alpha level 0.05 to find out if mean weight loss differs between two diets. Suppose our test statistic t is 1.34 and our degrees of freedom is 22. We would like to know if these results are statistically significant.
Compare the test statistic t to a critical value
The first approach we can use to determine if our results are statistically significant is to compare the test statistic t of 1.34 to the critical value in the t distribution table. The critical value is the value in the table that aligns with a two-tailed value of 0.05 and a degrees of freedom of 22. This number turns out to be 2.074:
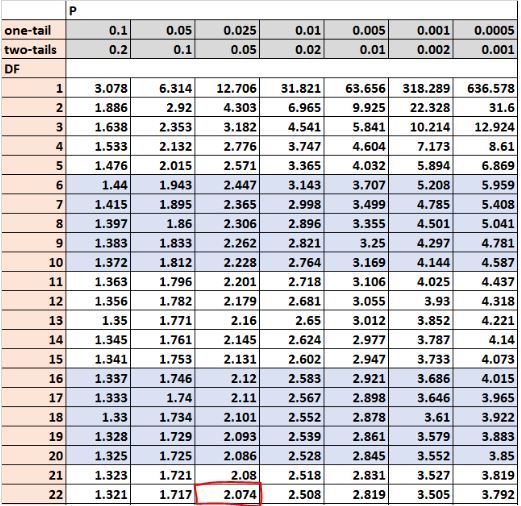
Since out test statistic t (1.34) is smaller than the critical value (2.074), we fail to reject the null hypothesis of our test. We do not have sufficient evidence to say that the mean weight loss between the two diets is statistically significant at alpha level 0.05.
Compare the p-value to a chosen alpha level
The second approach we can use to determine if our results are statistically significant is to find the p-value for the test statistic t of 1.34. In order to find this p-value, we can’t use the t distribution table because it only provides us with critical values, not p-values.
So, in order to find this p-value we need to use a T Score to P Value Calculator with the following inputs:
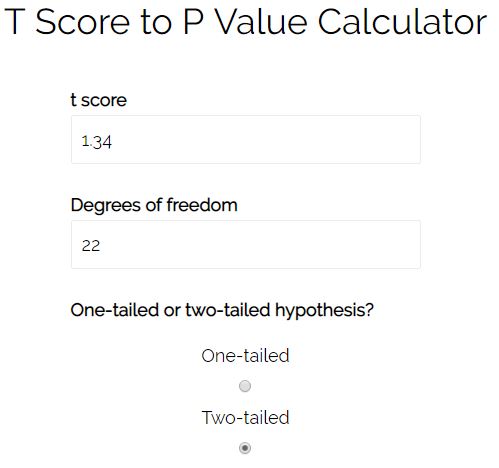
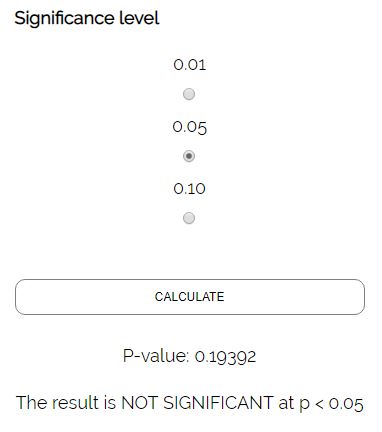
The p-value for a test statistic t of 1.34 for a two-tailed test with 22 degrees of freedom is 0.19392. Since this number is greater than our alpha level of 0.05, we fail to reject the null hypothesis of our test. We do not have sufficient evidence to say that the mean weight loss between the two diets is statistically significant at alpha level 0.05.
When to Use the t Distribution Table
If you are interested in finding the t critical value for a given significance level, degrees of freedom, and type of test (one-tailed or two-tailed), then you should use the t distribution table.
Instead, if you have a given test statistic t and you simply want to know the p-value of that test statistic, then you would need to use a T Score to P Value Calculator to do so.