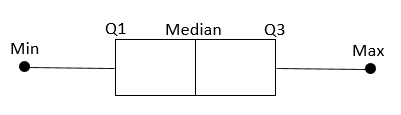
A box plot is a type of plot that we can use to visualize the five number summary of a dataset, which includes:
- The minimum
- The first quartile
- The median
- The third quartile
- The maximum
This tutorial explains how to create and modify box plots in Stata.
Example: Box Plots in Stata
We’ll use a dataset called auto to illustrate how to create and modify boxplots in Stata.
First, load the data by typing the following into the Command box and clicking Enter:
use http://www.stata-press.com/data/r13/auto
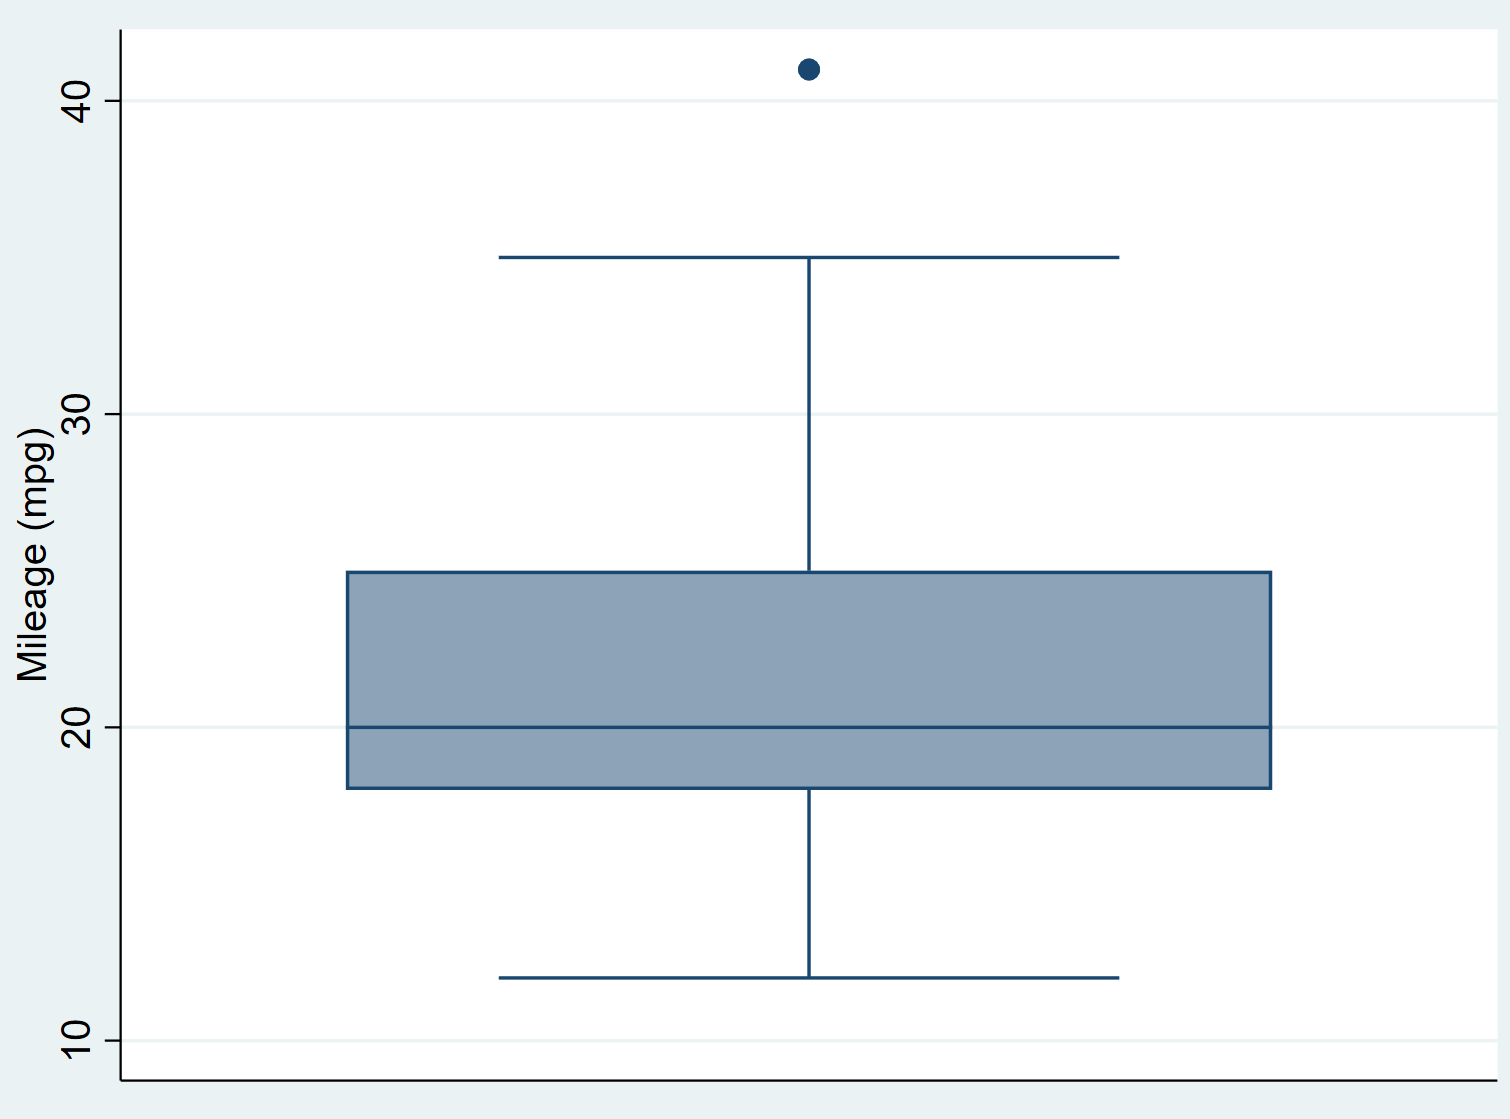
Vertical Box Plots
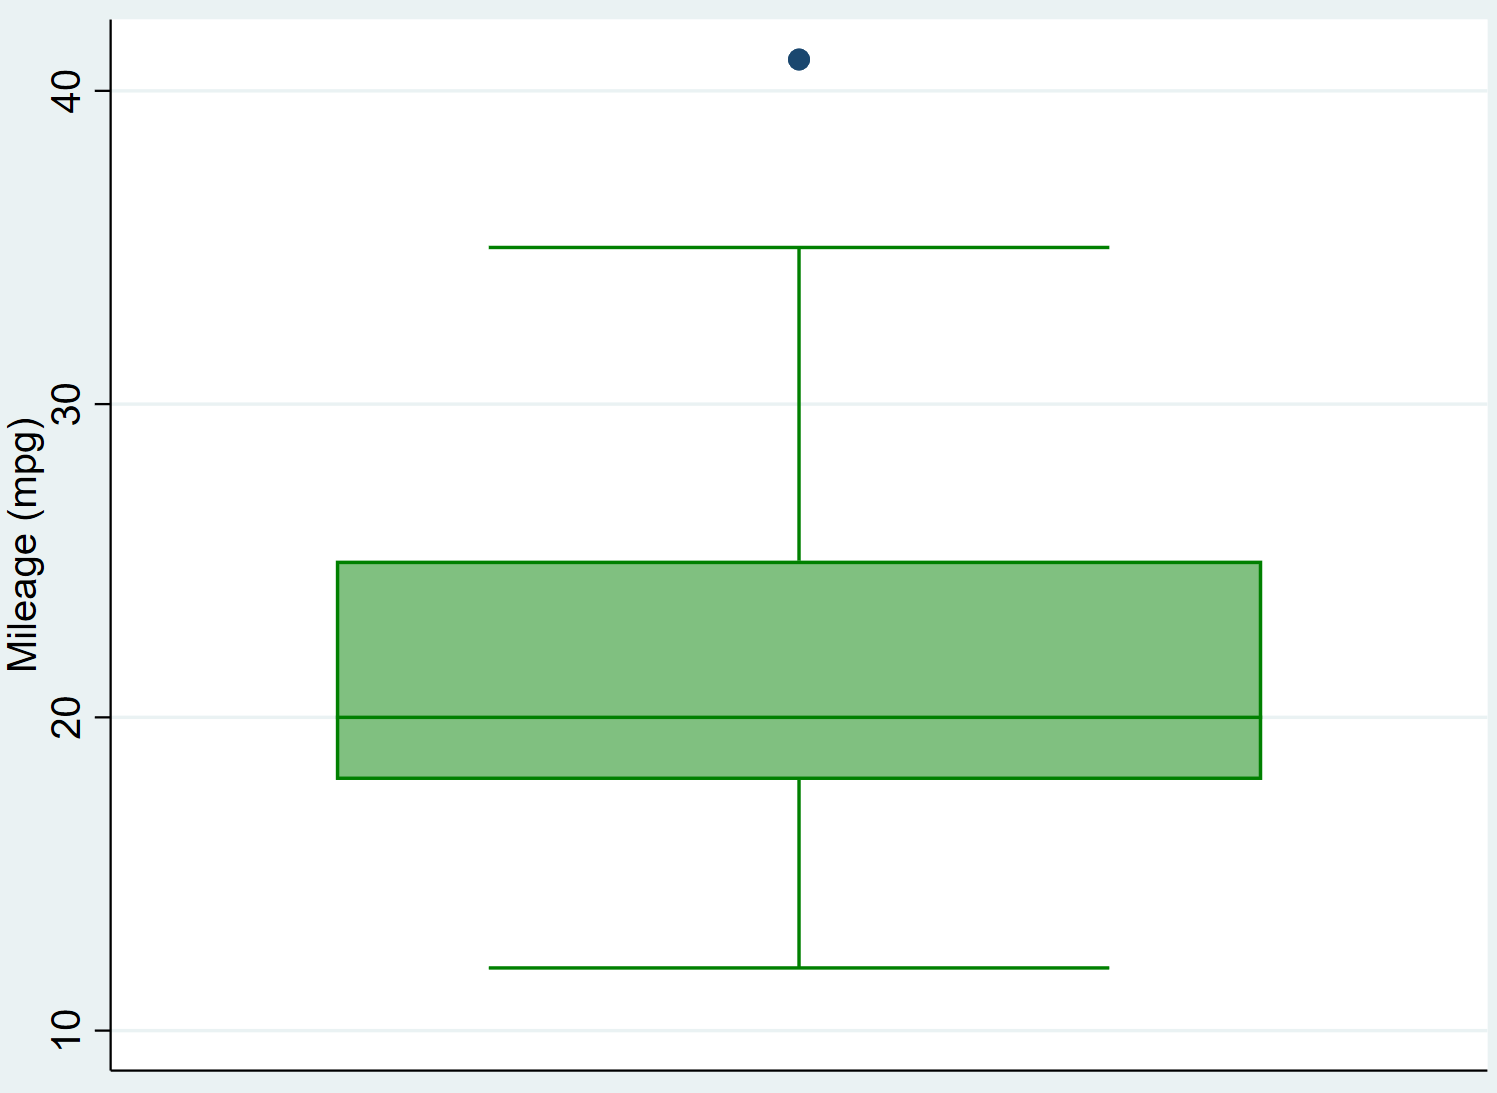
We can create a vertical box plot for the variable mpg by using the graph box command:
graph box mpg
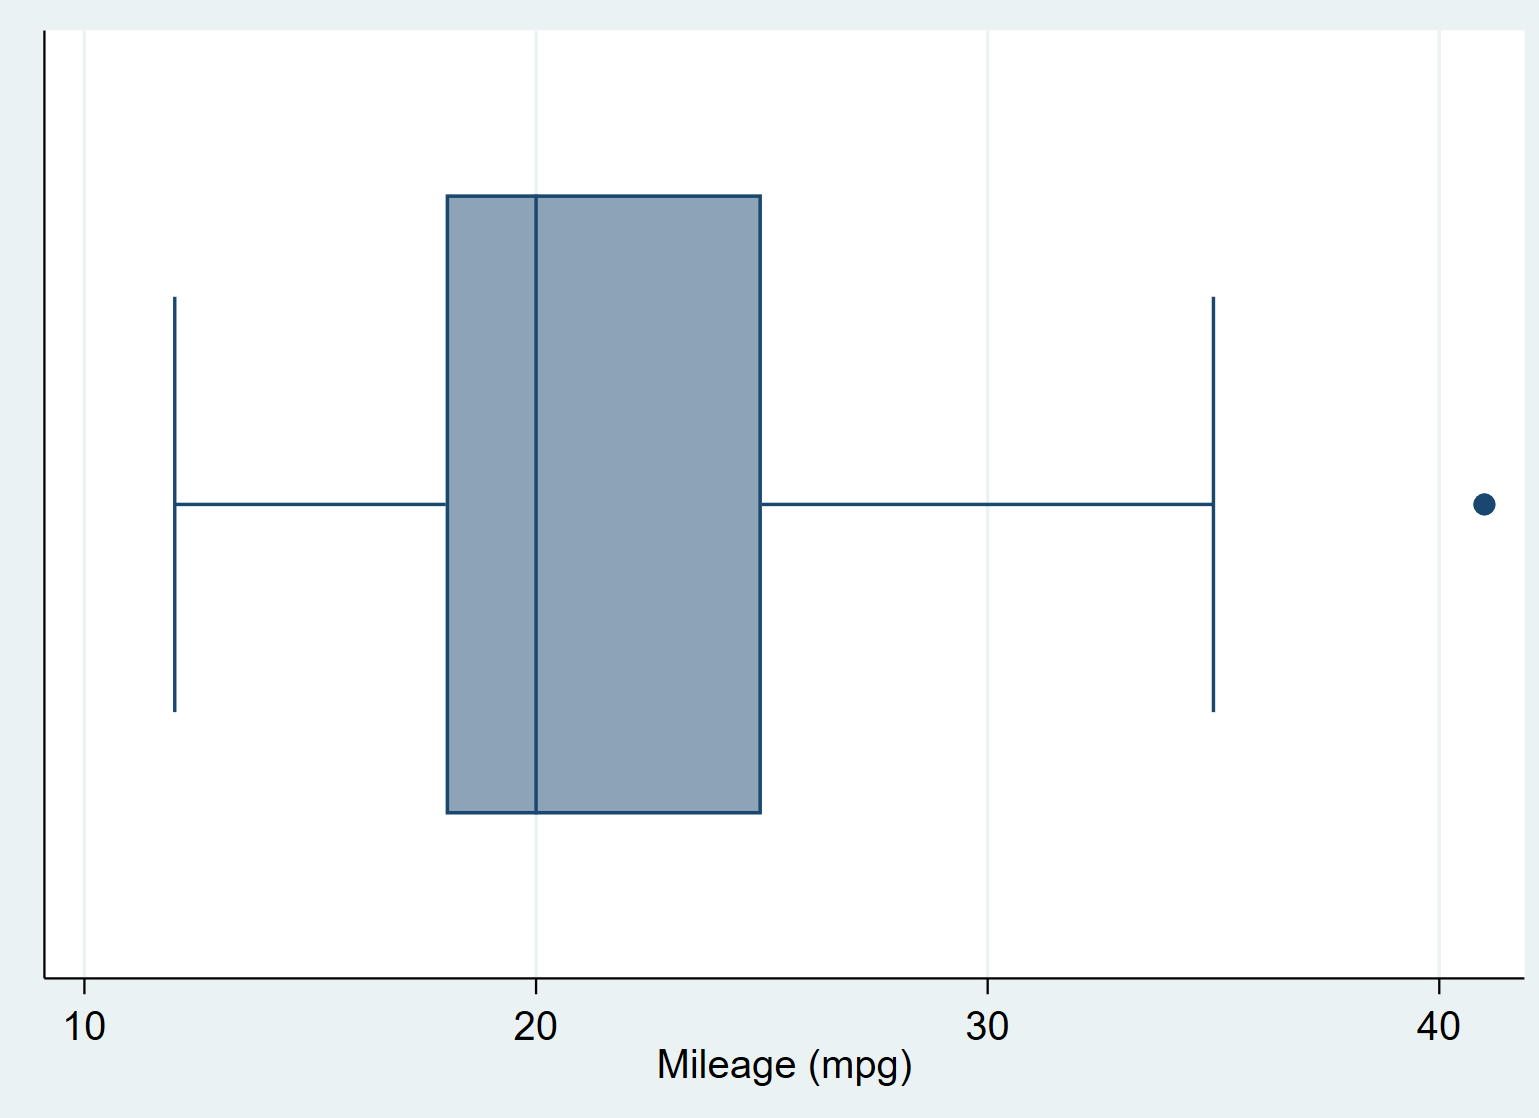
Horizontal Box Plots
Alternatively, we can create a horizontal box plot by using the graph hbox command:
graph hbox mpg
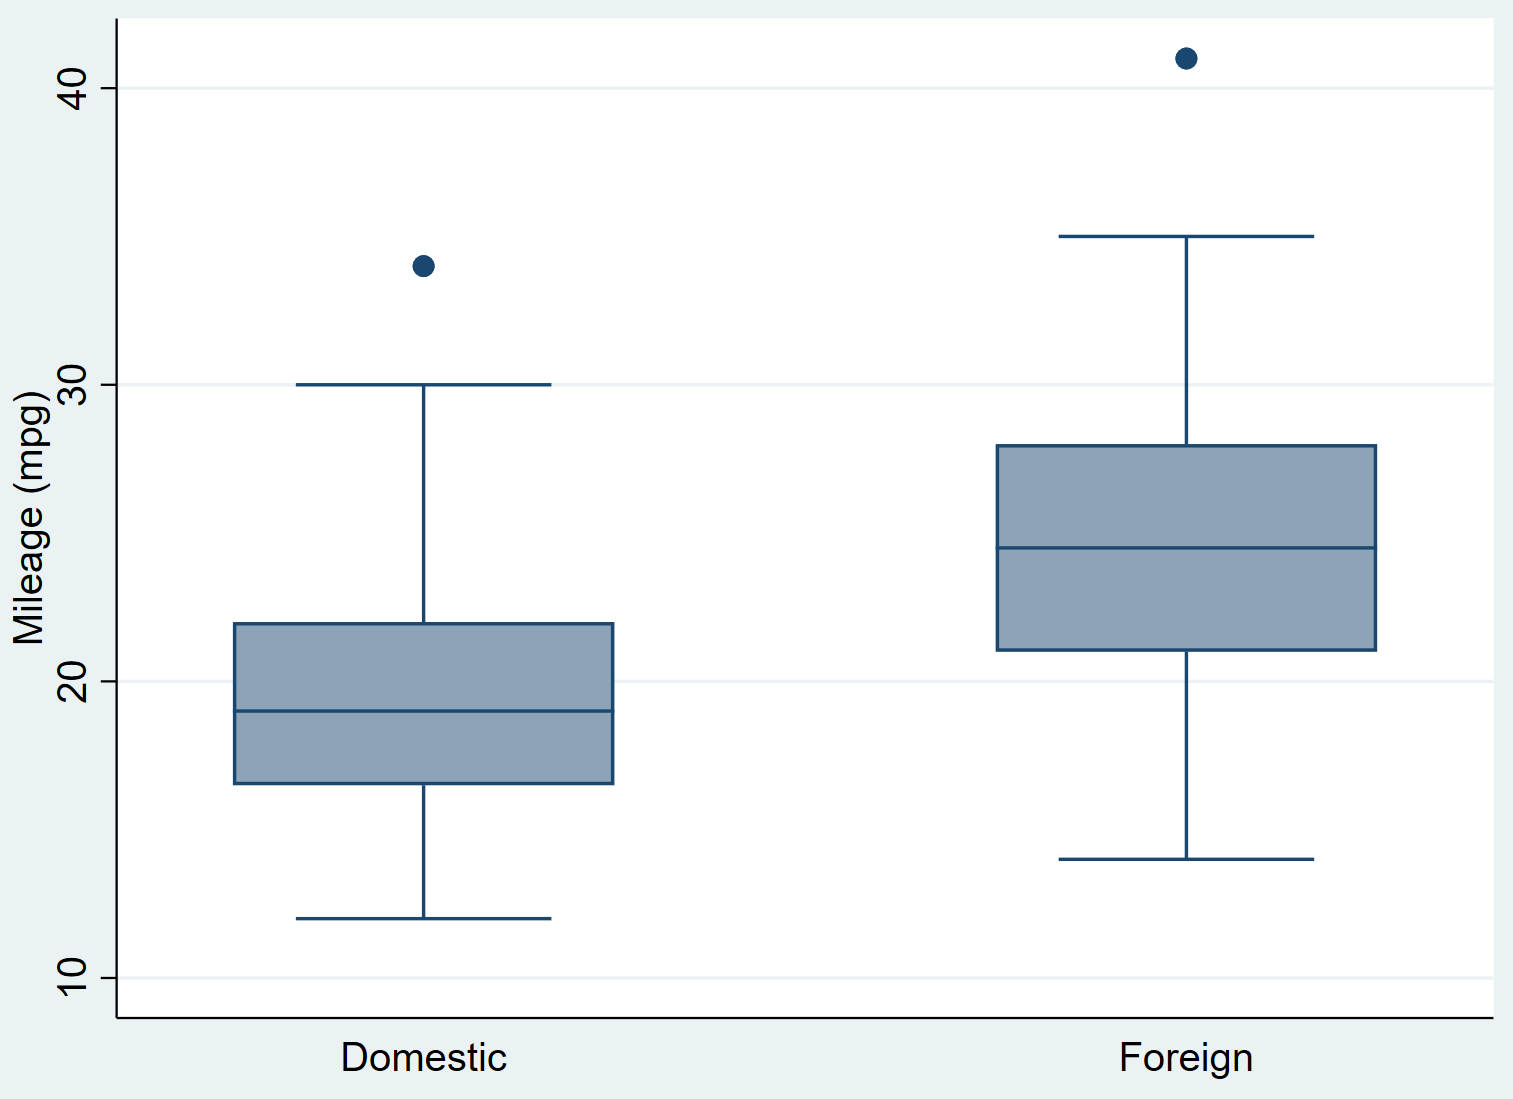
Box Plots by Category
We can also create several box plots based on a single categorical variable using the over() command. For example, the following command can be used to create box plots that show the distribution of mpg, based on the categorical variable foreign, which indicates whether a car is foreign or domestic.
graph box mpg, over(foreign)
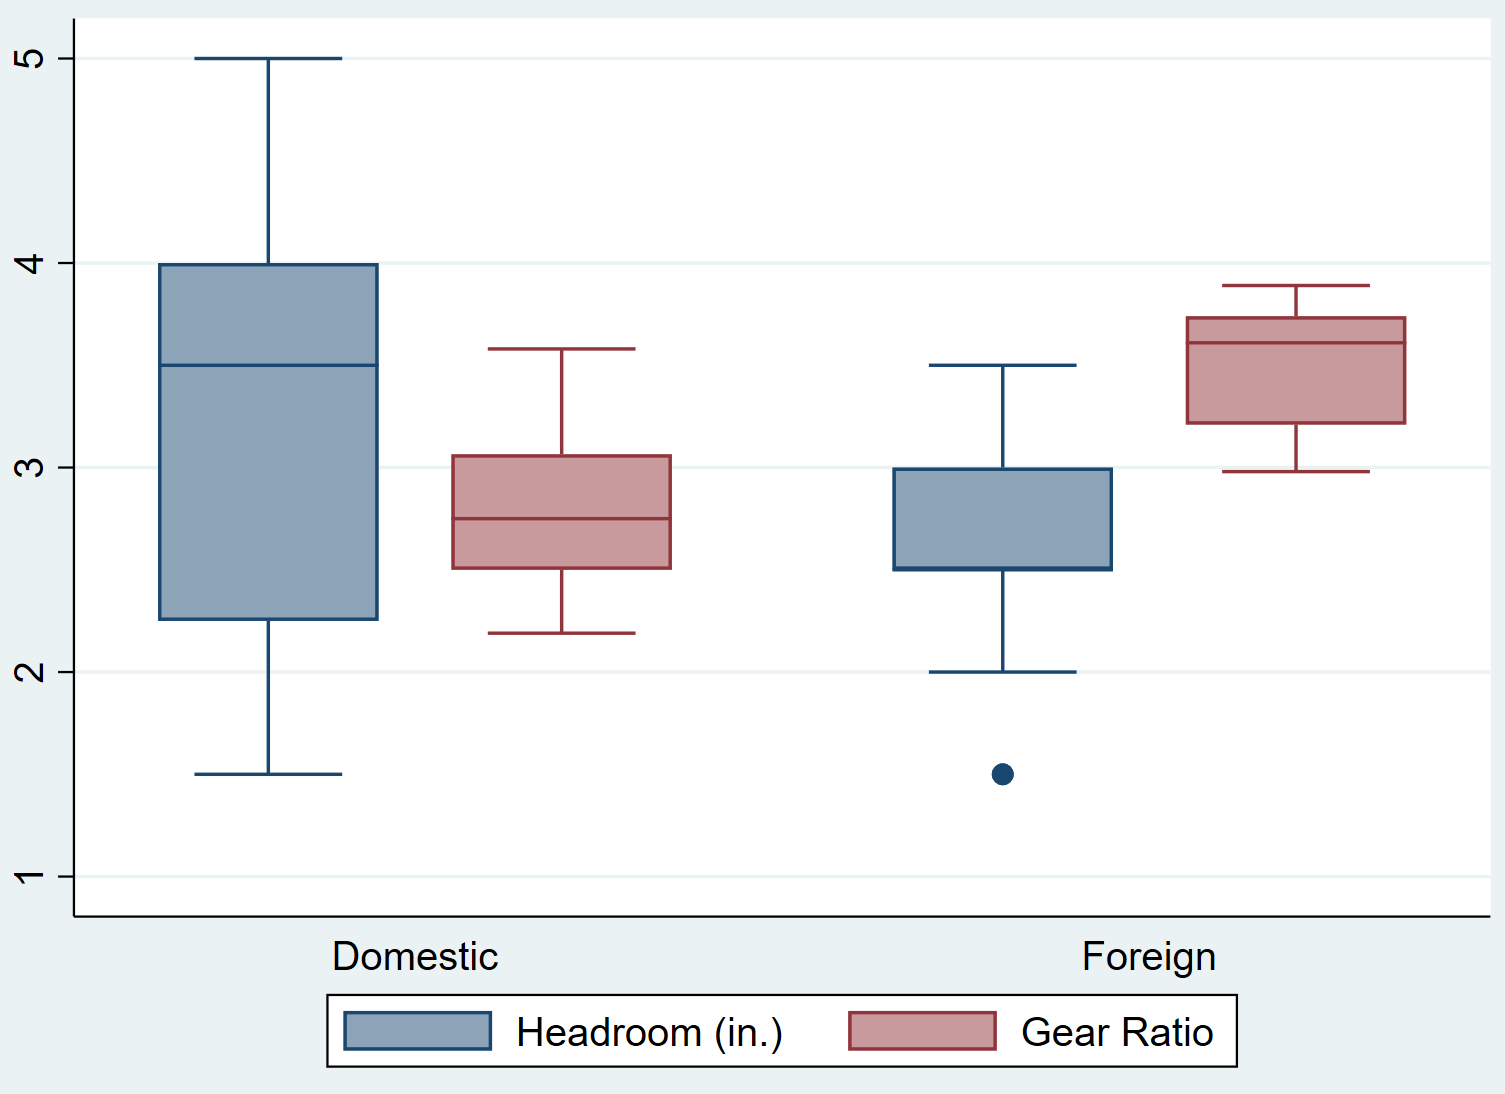
Multiple Box Plots by Category
We can also create box plots for more than one variable based on a categorical variable. For example, the following command can be used to create box plots for the variables headroom and gear_ratio, based on the categorical variable foreign:
graph box headroom gear_ratio, over(foreign)
Modifying the Appearance of Box Plots
We can use several different commands to modify the appearance of the box plots.
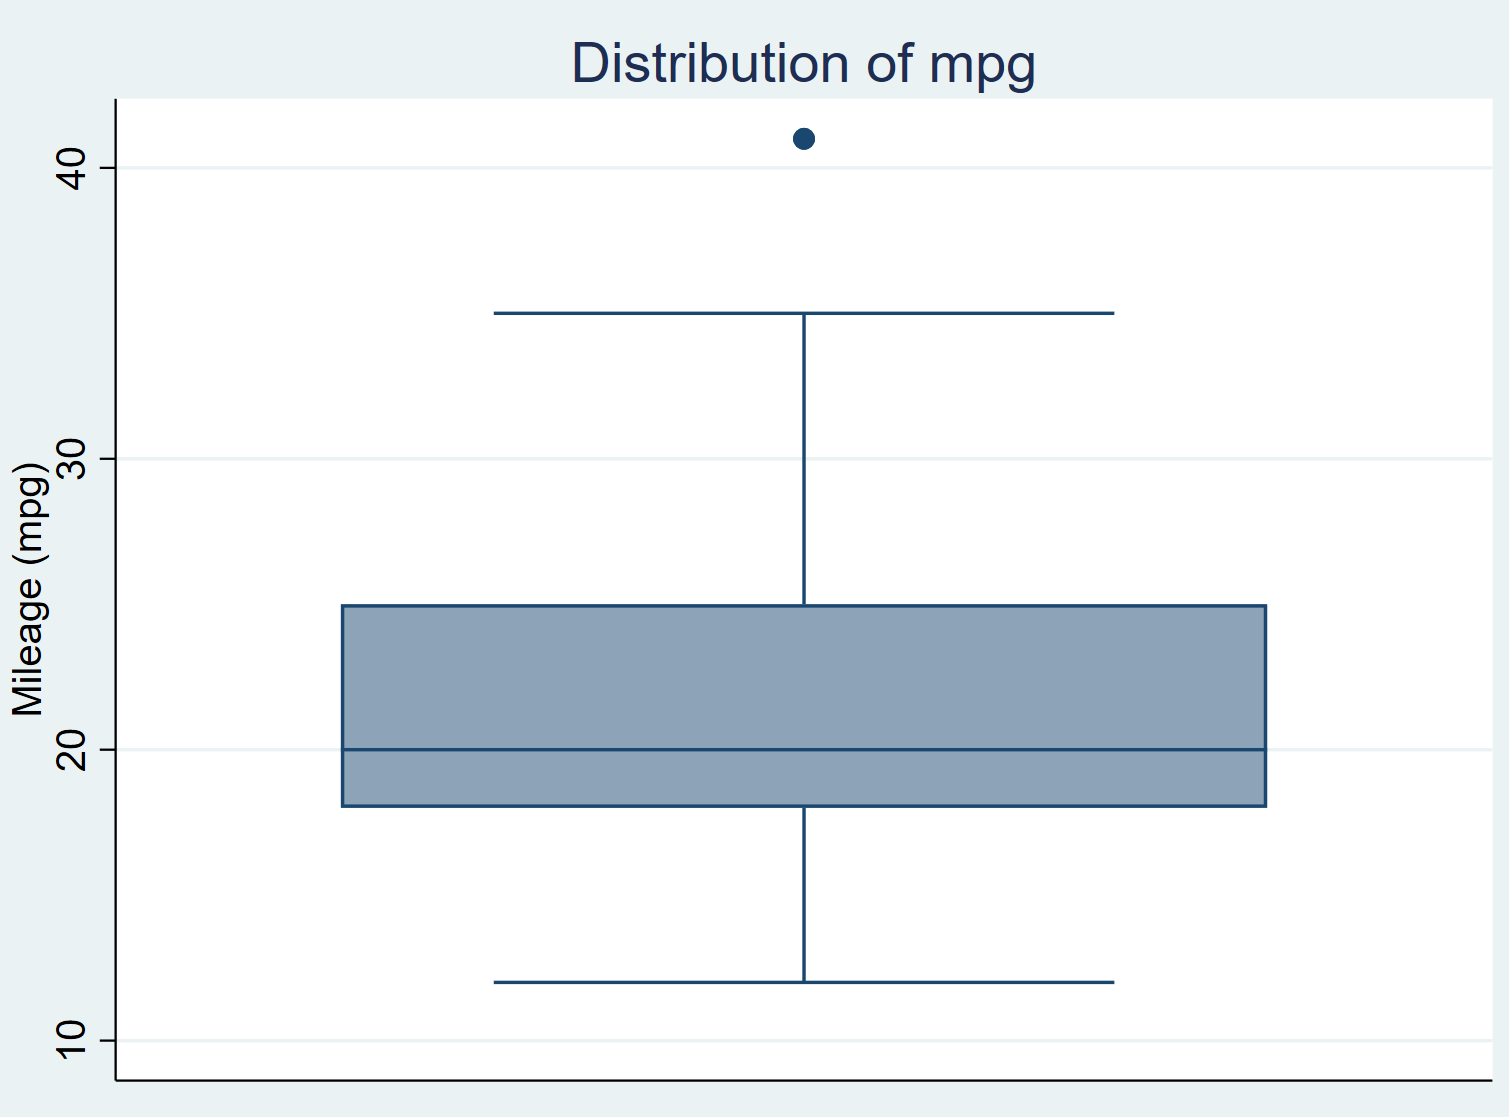
We can add a title to the plot using the title() command:
graph box mpg, title(“Distribution of mpg”)
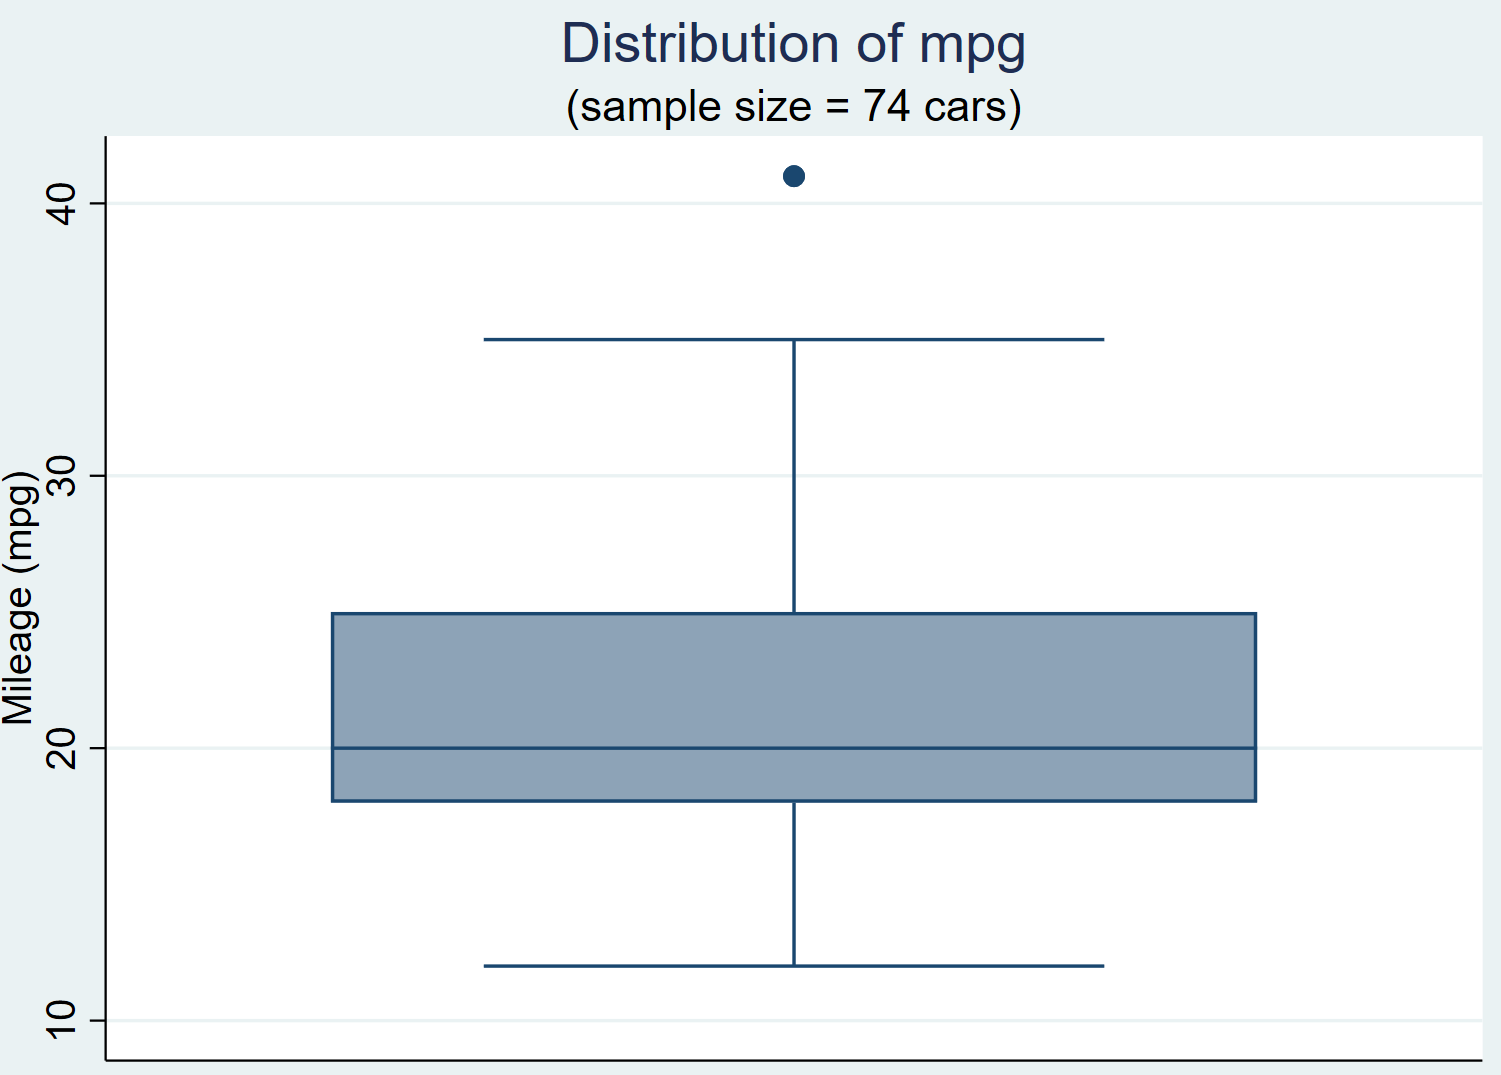
We can also add a subtitle underneath the title using the subtitle() command:
graph box mpg, title(“Distribution of mpg”) subtitle(“(sample size = 74 cars)”)
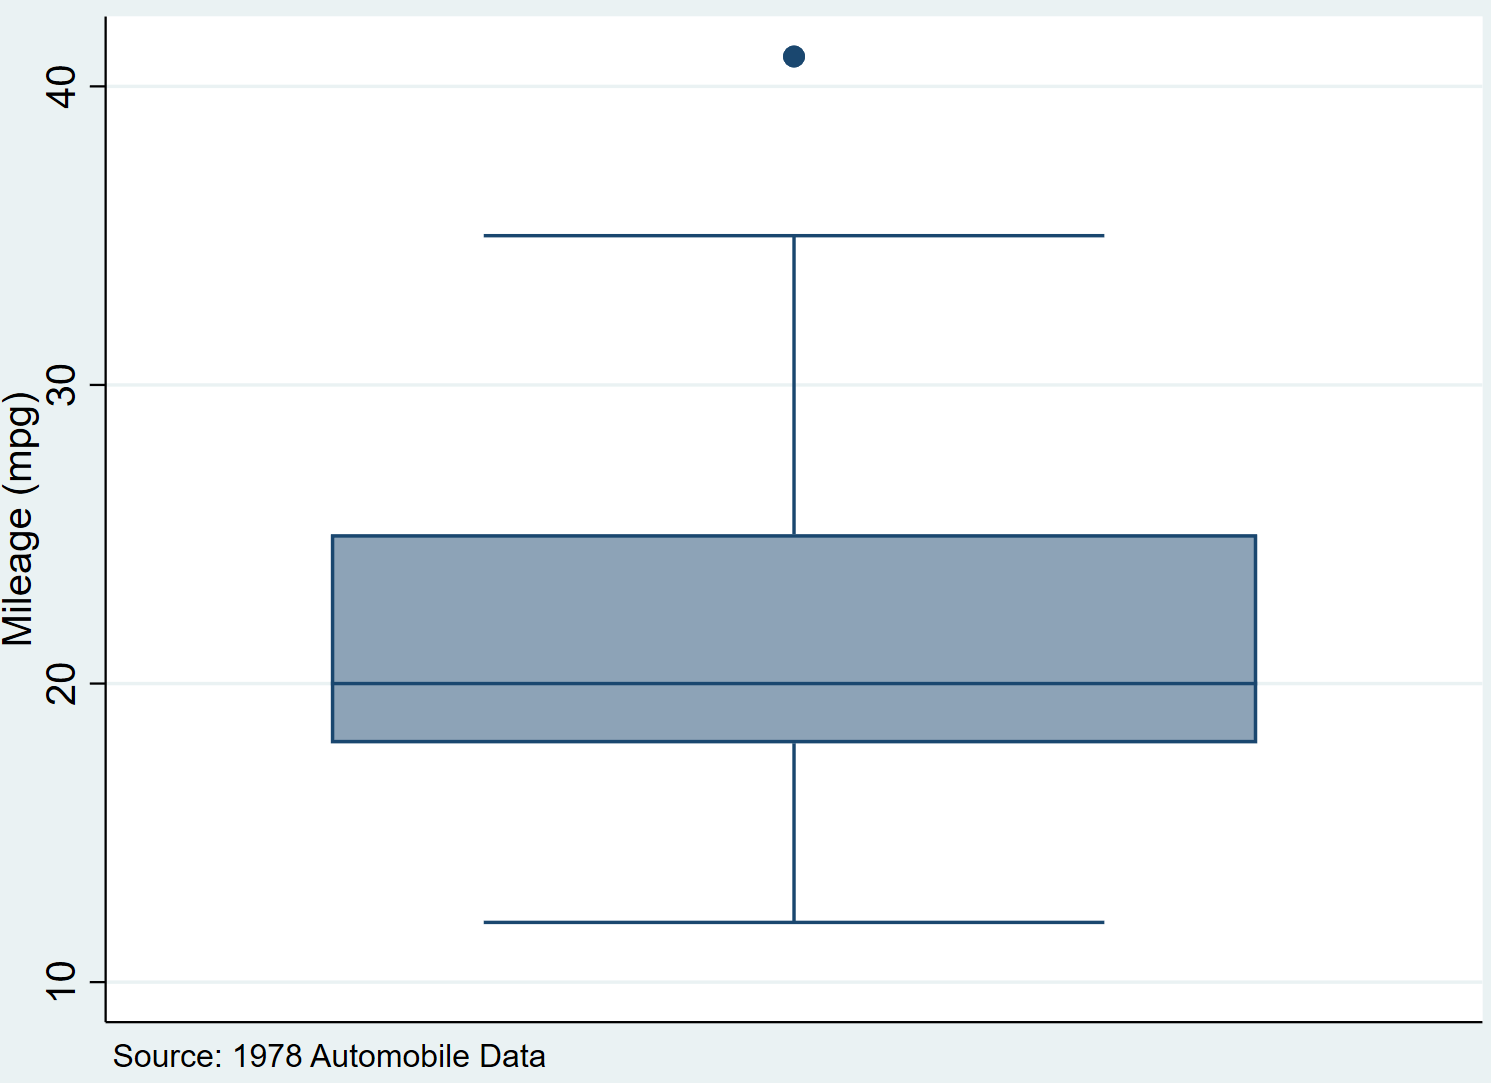
We can also add a note or comment at the bottom of the graph by using the note() command:
graph box mpg, note(“Source: 1978 Automobile Data”)
Lastly, we can change the actual color of the box plot by using the box(variable #, color(color_choice)) command:
graph box mpg, box(1, color(green))
A full list of available colors can be found in the Stata Documentation.