The normal distribution is the most common probability distribution in statistics.

Normal distributions have the following features:
- Bell shape
- Symmetrical
- Mean and median are equal; both are located at the center of the distribution
- About 68% of data falls within one standard deviation of the mean
- About 95% of data falls within two standard deviations of the mean
- About 99.7% of data falls within three standard deviations of the mean
The last three bullet points are known as the Empirical Rule, sometimes called the 68-95-99.7 rule.
Related: Empirical Rule (Practice Problems)
How to Draw a Normal Curve
To draw a normal curve, we need to know the mean and the standard deviation.
Example 1: Suppose the height of males at a certain school is normally distributed with mean of a standard deviation of
Step 1: Sketch a normal curve.
Step 2: The mean of 70 inches goes in the middle.
Step 3: Each standard deviation is a distance of 2 inches.

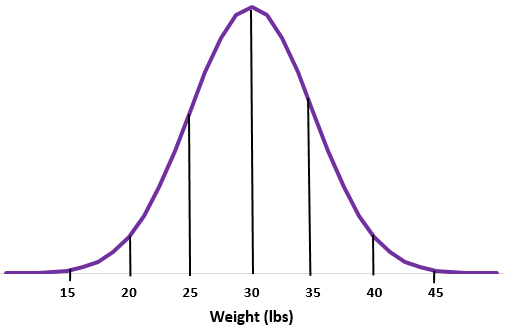
Example 2: Suppose the weight of a certain species of otters is normally distributed with mean of a standard deviation of
Step 1: Sketch a normal curve.
Step 2: The mean of 30 lbs goes in the middle.
Step 3: Each standard deviation is a distance of 5 lbs
How to Find Percentages Using the Normal Distribution

The empirical rule, sometimes called the 68-95-99.7 rule, says that for a random variable that is normally distributed, 68% of data falls within one standard deviation of the mean, 95% falls within two standard deviations of the mean, and 99.7% falls within three standard deviations of the mean.
Using this rule, we can answer questions about percentages.
Example: Suppose the height of males at a certain school is normally distributed with mean of a standard deviation of
Solution:
Step 1: Sketch a normal distribution with a mean of a standard deviation of
Step 2: A height of 74 inches is two standard deviations above the mean. Add the percentages above that point in the normal distribution.

2.35% + 0.15% = 2.5%
Approximately 2.5% of males at this school are taller than 74 inches.
Solution:
Step 1: Sketch a normal distribution with a mean of a standard deviation of
Step 2: A height of 68 inches and 72 inches is one standard deviation below and above the mean, respectively. Simply add the percentages between these two points in the normal distribution.

34% + 34% = 68%
Approximately 68% of males at this school are between 68 inches and 72 inches tall.
How to Find Counts Using the Normal Distribution
We can also use the empirical rule to answer questions about counts.
Example: Suppose the weight of a certain species of otters is normally distributed with mean of a standard deviation of
A certain colony has 200 of these otters. Approximately how many of these otters weigh more than 35 lbs?
Solution:
Step 1: Sketch a normal distribution with a mean of a standard deviation of
Step 2: A weight of 35 lbs is one standard deviation above the mean. Add the percentages above that point in the normal distribution.

13.5% + 2.35% + 0.15% = 16%
Step 3: Since there are 200 otters in the colony, 16% of 200 = 0.16 * 200 = 32
Approximately 32 of the otters in this colony weight more than 35 lbs.
Approximately how many of the otters in this colony weigh less than 30 lbs?
Instead of walking through all of the steps we just did above, we can recognize that the median of a normal distribution is equal to the mean, which is 30 lbs in this case.
This means that half of the otters weight more than 30 lbs and half weight less than 30 lbs. This means that 50% of the 200 otters weight less than 30 lbs, so 0.5 * 200 = 100 otters.
Additional Resources
The following tutorials offer additional information about the normal distribution:
6 Real-Life Examples of the Normal Distribution
Normal Distribution vs. t-Distribution: The Difference
How to Make a Bell Curve in Excel
How to Make a Bell Curve in Python