The most common way to compare the means between two independent groups is to use a two-sample t-test. However, this test assumes that the variances between the two groups is equal.
If you suspect that the variance between the two groups is not equal, then you can instead use Welch’s t-test, which is the non-parametric equivalent of the two-sample t-test.
This tutorial explains how to perform Welch’s t-test in Stata.
Example: Welch’s t-test in Stata
For this example we will use the fuel3 dataset, which contains the mpg of 12 cars that received a certain fuel treatment and 12 cars that did not.
Use the following steps to perform a Welch’t t-test to determine if there is a difference in the mean mpg between the two groups.
Step 1: Load and view the data.
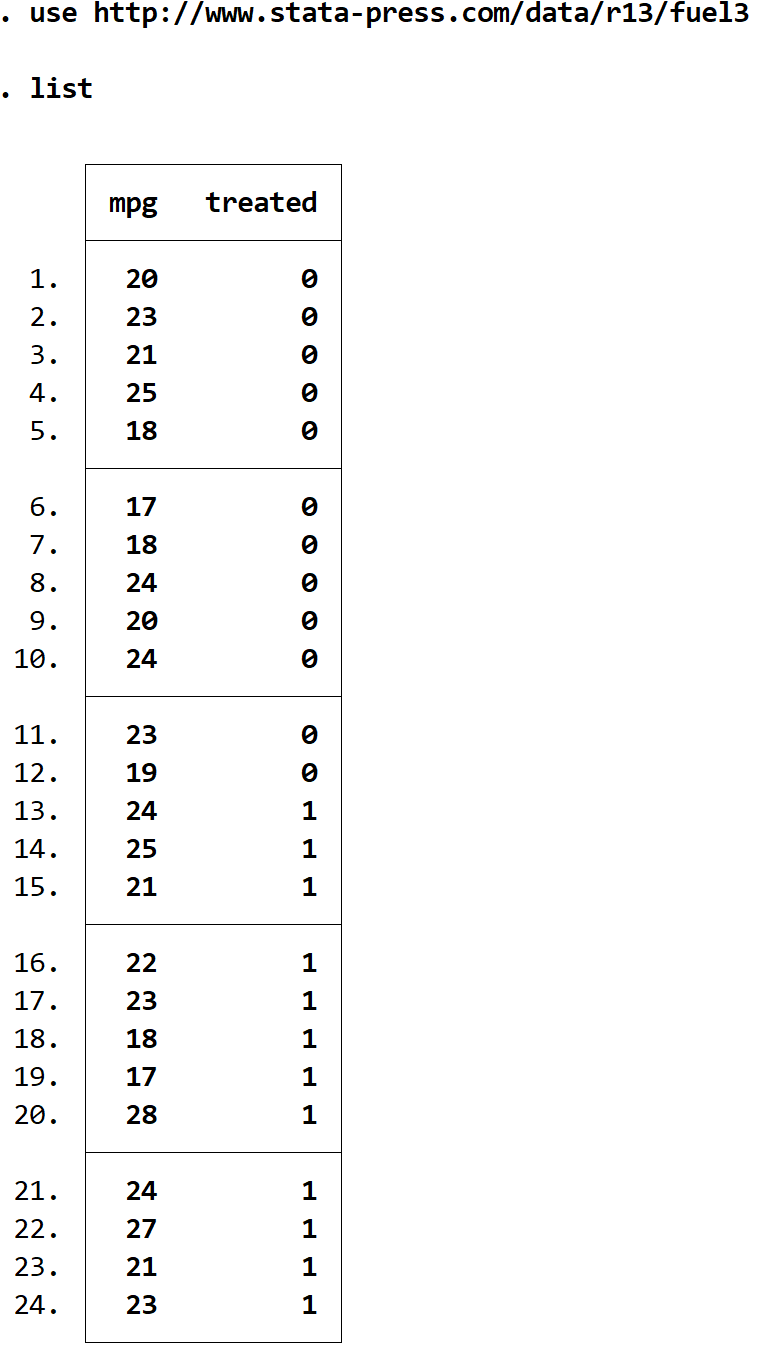
First, load the dataset by typing the following command into the Command box:
use http://www.stata-press.com/data/r13/fuel3
View the raw data by using the following command:
list
Step 2: Visualize the data.
Before we perform Welch’s t-test, let’s first create two box plots to visualize the distribution of mpg for each group:
graph box mpg, over(treated)
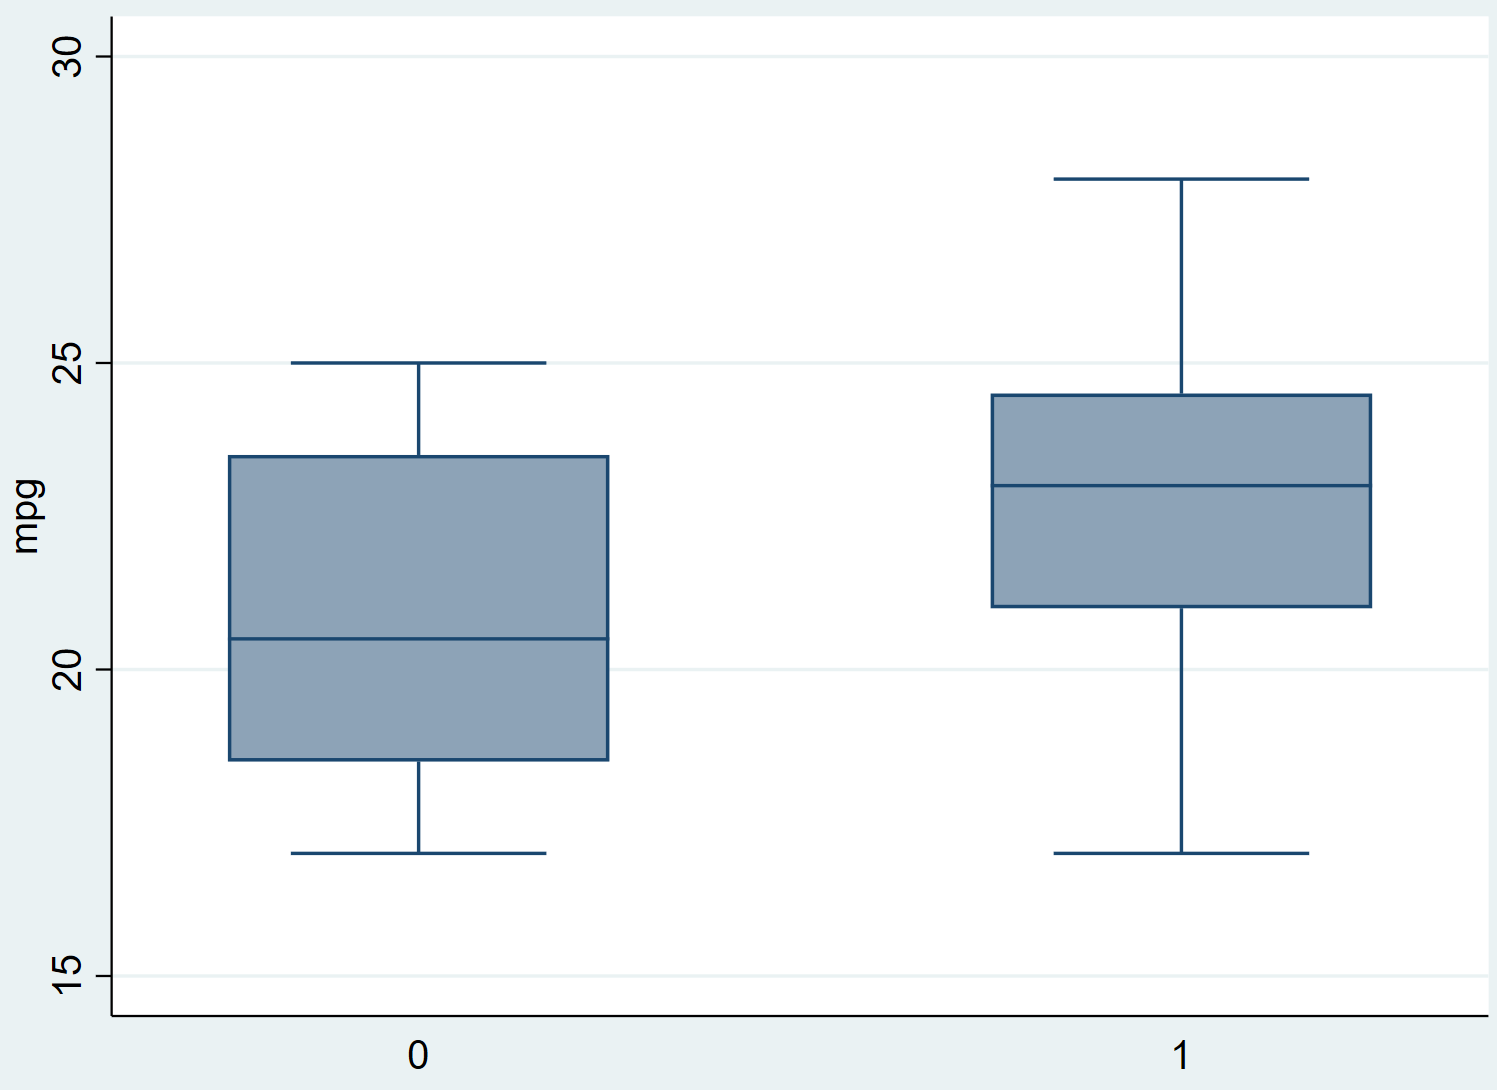
We can see that the mpg for group 1 (the group that received the fuel treatment) tends to be higher than that of group 0. We can also see that the variance for group 1 looks quite a bit smaller than that of group 0 (the width of the box is smaller).
Step 3: Perform Welch’s t-test
Use the following syntax to perform Welch’s t-test:
ttest variable_to_measure, by(grouping_variable) welch
Here is the syntax for our particular example:
ttest mpg, by(treated) welch
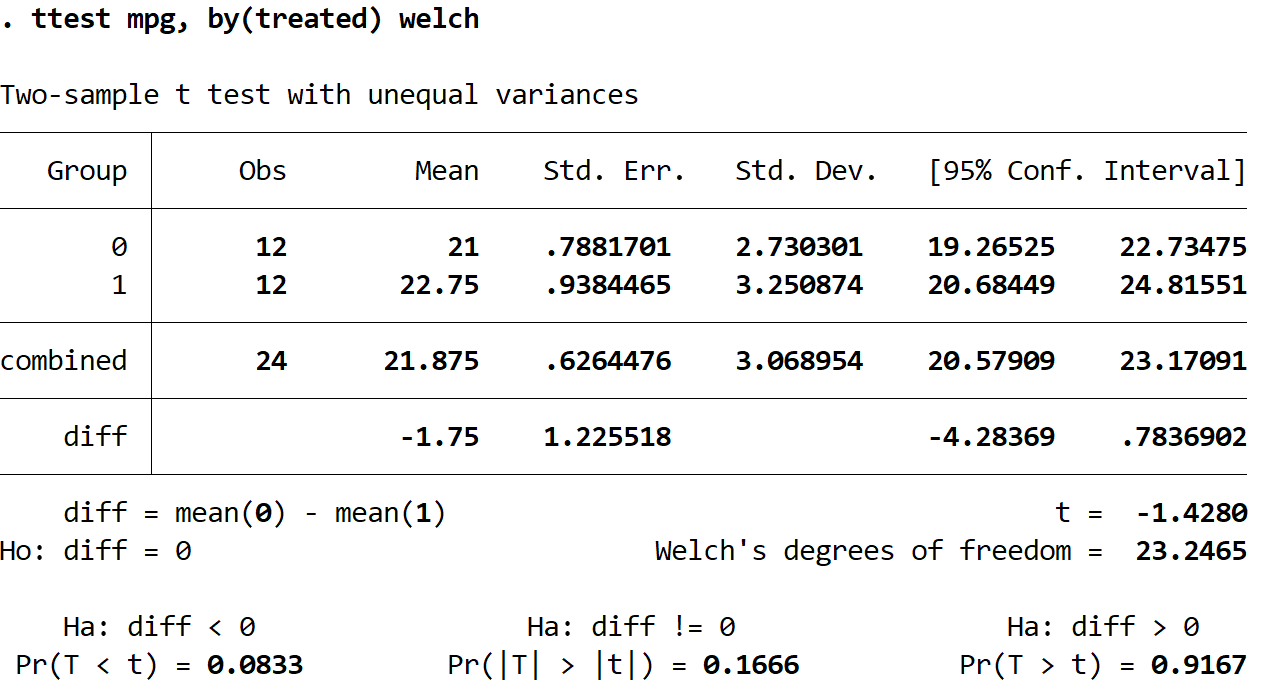
Here is how to interpret the output:
- The mean mpg for Group 0 was 21. The 95% confidence interval for the true population mean was (19.26525, 22.73745).
- The mean mpg for Group 1 was 22.75. The 95% confidence interval for the true population mean was (20.68449, 24.81551).
- The mean difference in mpg for Group 0 – Group 1 was -1.75. The 95% confidence interval for the true difference in population means was (-4.28369, .7836902).
- The test statistic, t, for Welch’s t-test was -1.4280.
- Because we are interested in the alternative hypothesis that the mean mpg was simply different between the two groups, we will look at the p-value associated with Ha: diff != 0, which turns out to be 0.1666. Since this value is not less than 0.05, we do not have sufficient evidence to say that the mean mpg between the two groups is different.
Step 4: Report the results.
Lastly, we want to report the results of our Welch’s t-test. Here is an example of how to do so:
A Welch’s t-test was performed to determine if there was a statistically significant difference in mpg between a group of cars that received a fuel treatment and a group that did not. The sample size for both groups was 12 cars.
A Welch’s t-test revealed that there was not a statistically significant difference in means (t = -1.4280, p = 0.1666) between the two groups.
The 95% confidence interval for the true mean difference in group 0 (non-treatment group) and group 1(treatment group) was found to be (-4.28369, .7836902).