A line of best fit is the line that best “fits” the trend of a dataset.
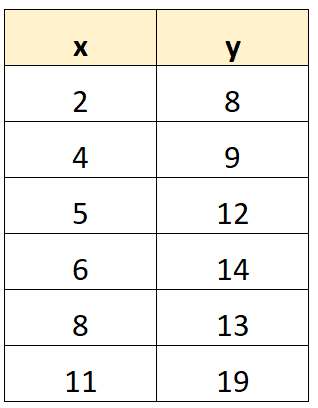
This tutorial provides a step-by-step example of how to calculate the line of best fit for the following dataset on a TI-84 calculator:
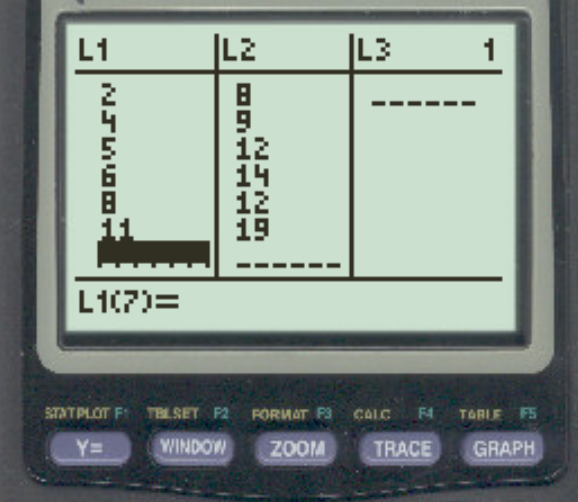
Step 1: Enter the Data
First, we will enter the data values. Press STAT, then press EDIT. Then enter the x-values of the dataset in column L1 and the y-values in column L2:
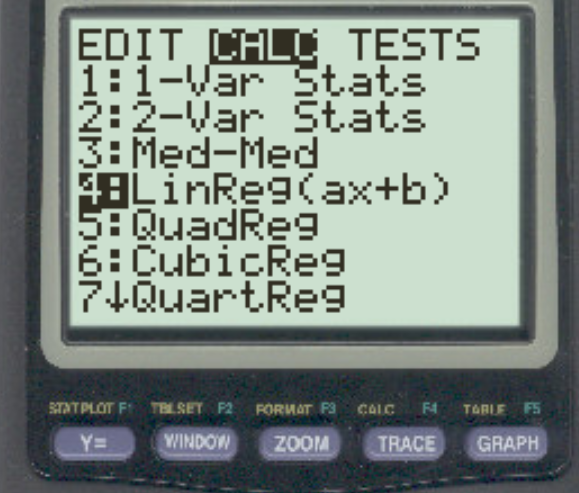
Step 2: Find the Line of Best Fit
Next, we will find the line of best fit.
Press Stat, then scroll over to CALC. Then scroll down to LinReg(ax+b) and press ENTER.
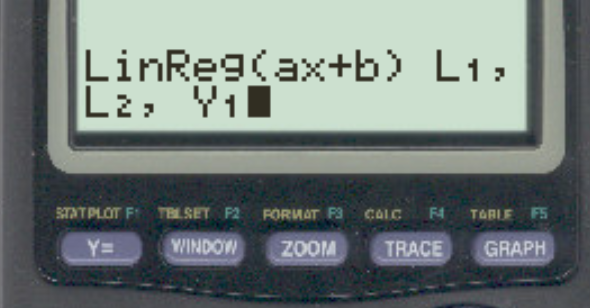
Then press 2nd and 1 and comma , then press 2nd and 2 and comma , then press VARS and scroll over to to Y-VARS and press ENTER.
Your screen should look like this:
Press ENTER once more and the following line of best fit will be displayed:
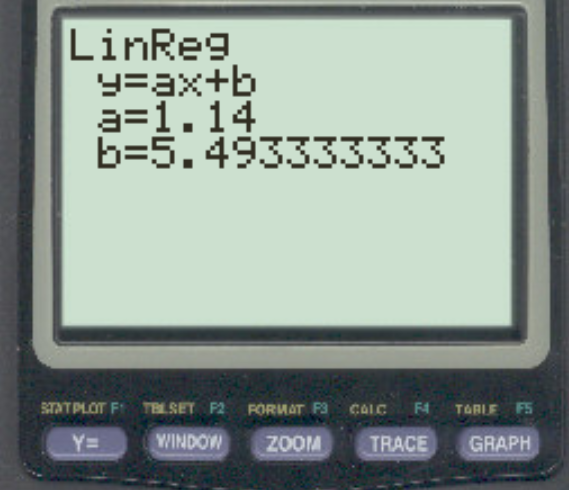
The line of best fit is: y = 5.493 + 1.14x
Step 3: Plot the Line of Best Fit
Lastly, we will plot the line of best fit.
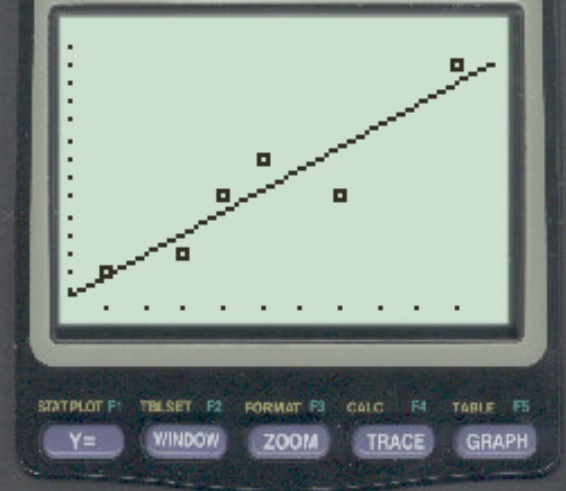
Press ZOOM and then scroll down to ZOOMSTAT and press ENTER.
The following scatterplot with the line of best fit will be shown:
Additional Resources
How to Perform Linear Regression on a TI-84 Calculator
How to Perform Quadratic Regression on a TI-84 Calculator
How to Create a Residual Plot on a TI-84 Calculator