You can use the following basic syntax to draw an arrow in a plot in ggplot2:
library(ggplot2)

ggplot(df, aes(x=x, y=y)) +
  geom_point() +
  geom_segment(aes(x=5, y=6, xend=8, yend=9), arrow = arrow(length=unit(0.5, 'cm')))
Here is what each argument does in the geom_segment() function:
- x: The x-value to start at
- y: The y-value to start at
- xend: The x-value to end at
- yend: The y-value to end at
- arrow: The length of the arrow head
The following example shows how to draw an arrow using ggplot2 in practice.
Example: Draw Arrows in ggplot2
Suppose we have the following data frame that contains information on the number of points scored and rebounds collected by various basketball players:
#create data frame
df frame(points=c(3, 3, 5, 6, 7, 8, 9, 9, 8, 5),
                 rebounds=c(2, 6, 5, 5, 8, 5, 9, 9, 8, 6))

#view data frame
df

   points rebounds
1       3        2
2       3        6
3       5        5
4       6        5
5       7        8
6       8        5
7       9        9
8       9        9
9       8        8
10      5        6
We can use the following syntax to create a scatter plot in ggplot2 and add an arrow to specific location on the plot:
library(ggplot2)

#create scatterplot and add arrow
ggplot(df, aes(x=points, y=rebounds)) +
  geom_point() +
  geom_segment(aes(x=5, y=6, xend=8, yend=9), arrow = arrow(length=unit(.5, 'cm')))
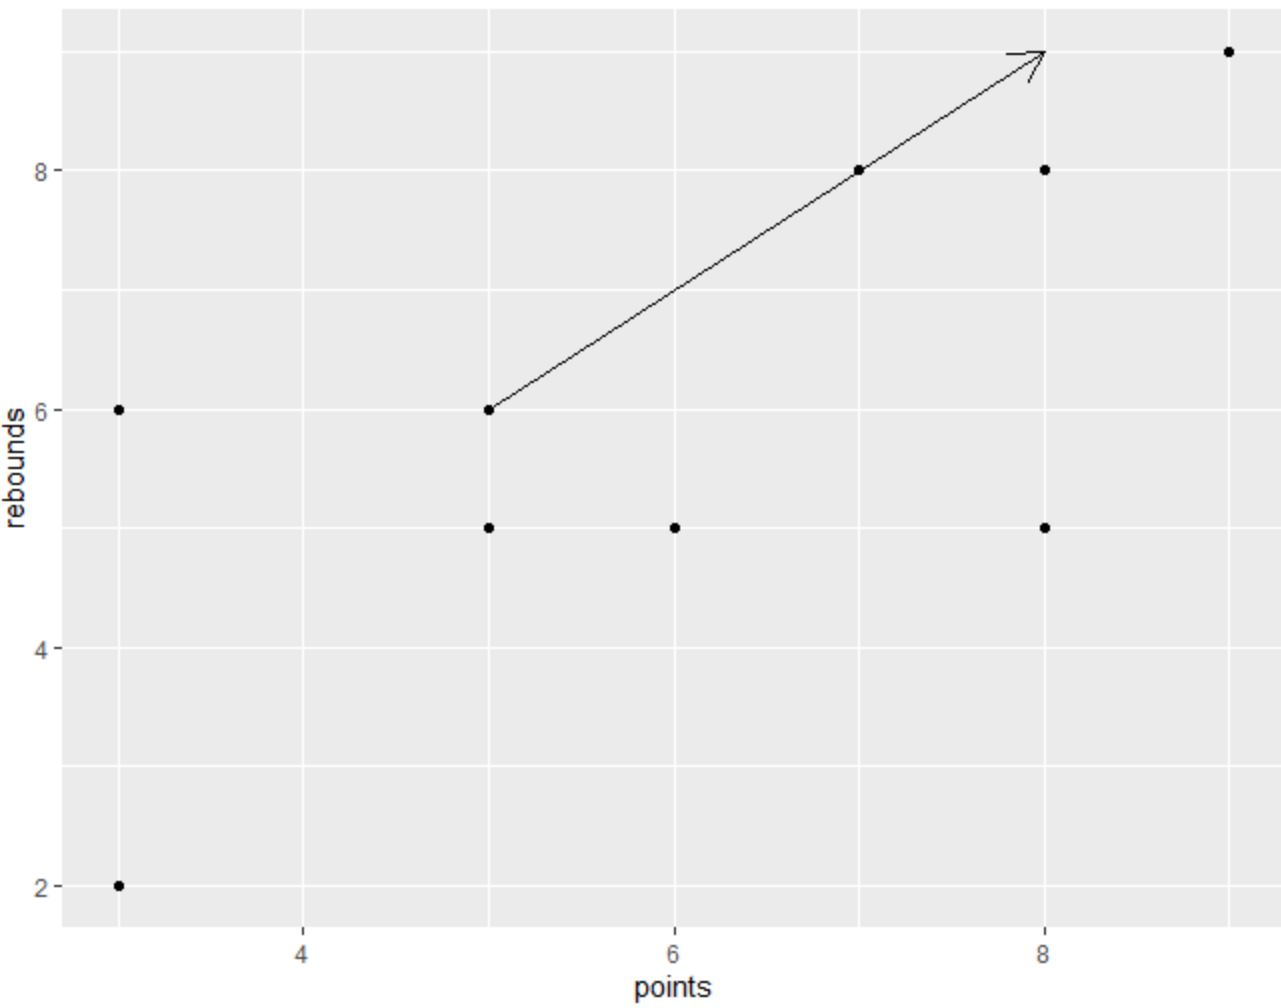
Feel free to modify the value in the arrow() function to increase or decrease the size of the arrow head.
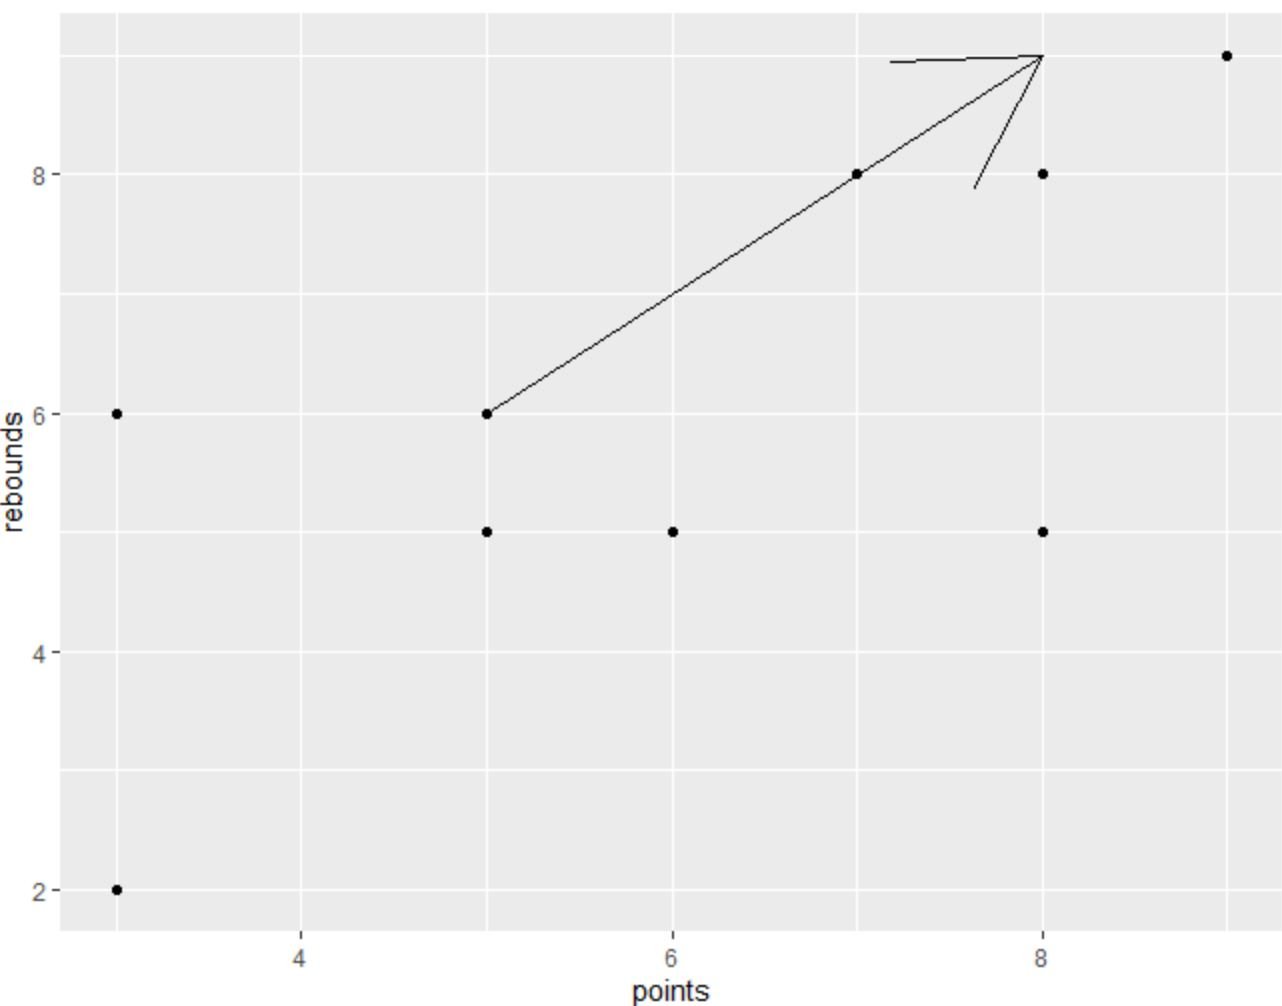
For example, the following code shows how to increase the size:
library(ggplot2)

#create scatterplot and add arrow with increased arrow head size
ggplot(df, aes(x=points, y=rebounds)) +
  geom_point() +
  geom_segment(aes(x=5, y=6, xend=8, yend=9), arrow = arrow(length=unit(2, 'cm')))
You can also use the color and lwd arguments to change the color and line width of the arrow, respectively:
library(ggplot2)

#create scatterplot and add customized arrow
ggplot(df, aes(x=points, y=rebounds)) +
  geom_point() +
  geom_segment(aes(x=5, y=6, xend=8, yend=9), arrow = arrow(length=unit(.5, 'cm')),
               color='red', lwd=3)

Feel free to play around with the various arguments in the geom_segment() function to create an arrow that looks exactly how you’d like.
Additional Resources
The following tutorials explain how to perform other common tasks in ggplot2:
How to Remove Gridlines in ggplot2
How to Shade an Area in ggplot2
How to Change X-Axis Labels in ggplot2