An ANOVA (Analysis of Variance) is used to determine whether or not there is a statistically significant difference between the means of three or more independent groups.
If the p-value from the ANOVA is less than some chosen significance level, we can reject the null hypothesis and conclude that we have sufficient evidence to say that at least one of the means of the groups is different from the others.
However, this doesn’t tell us which groups are different from each other. It simply tells us that not all of the group means are equal. In order to find out exactly which groups are different from each other, we must conduct a post-hoc test.
If one of the groups in the study is considered the control group, then we should use Dunnett’s test as the post-hoc test following the ANOVA.
Dunnett’s Test: Definition
We can use the following two steps to perform Dunnett’s test:
Step 1: Find Dunnett’s critical value.
First, we must find Dunnett’s critical value. This is calculated as:
Dunnett’s Critical value: td√2MSw/n
where:
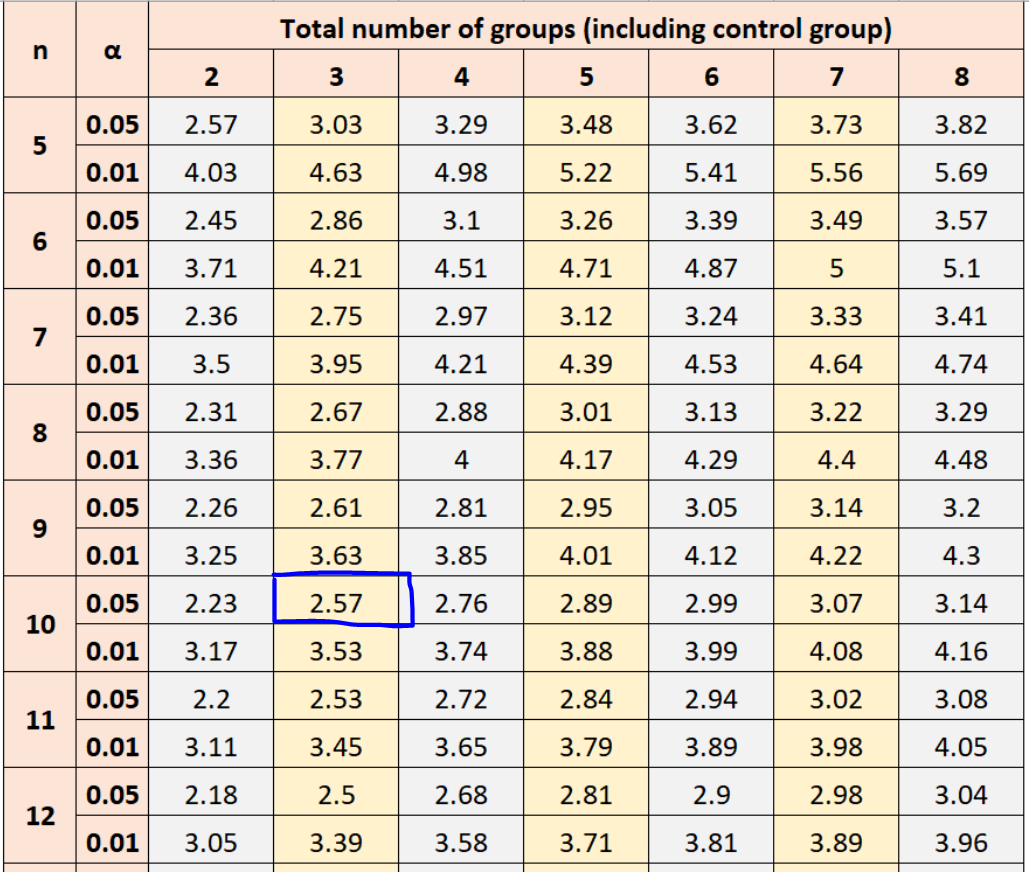
- td: The value found in Dunnett’s Table for a given alpha level, number of groups, and group sample sizes.
- MSw: The Mean Squares of the “Within Group” in the ANOVA output table
- n: The size of the group samples
Step 2: Compare the differences in group means to Dunnett’s critical value.
Next, we calculate the absolute difference between the mean of each group with the mean of the control group. If the difference exceeds Dunnett’s critical value, then that difference is said to be statistically significant.
The following example shows how to perform Dunnett’s test in practice.
Dunnett’s Test: Example
Suppose a teacher wants to know whether or not two new studying techniques have the potential to increase exam scores for her students. To test this, she randomly splits her class of 30 students into the following three groups:
- Control Group: 10 students
- New Study technique 1: 10 students
- New Study Technique 2: 10 students
After one week of using their assigned study technique, each student takes the same exam. The results are as follows:
- Mean exam score of control group: 81.6
- Mean exam score of new study technique 1 group: 85.8
- Mean exam score of new study technique 2 group: 87.7
- Mean Squares of the “Within Group” in the ANOVA output table: 23.3
Using this information, we can perform Dunnett’s test to determine if either of the two new study techniques produce significantly different mean exam scores compared to the control group.
Step 1: Find Dunnett’s critical value.
Using α = .05, group sample size n = 10 and total groups = 3, Dunnett’s table tells us to use a value of 2.57 in the critical value calculation.
Next, we can plug this number into the formula to find Dunnett’s Critical value:
Dunnett’s Critical value: td√2MSw/n = 2.57√2(23.3)/10 = 5.548
Step 2: Compare the differences in group means to Dunnett’s critical value.
The absolute difference between the means of each study technique and the control group are as follows:
- Abs. diff between new technique 1 and control: |85.8 – 81.6| = 4.2
- Abs. diff between new technique 2 and control: |87.7 – 81.6| = 6.1
Only the absolute difference between technique 2 and the control group is greater than Dunnett’s critical value of 5.548.
Thus, we can say that the new studying technique #2 produces significantly different exam scores compared to the control group, but the new studying technique #1 does not.
Additional Resources
An Introduction to the One-Way ANOVA
A Guide to Using Post Hoc Tests with ANOVA
How to Perform Dunnett’s Test in R