The Friedman Test is a non-parametric alternative to the Repeated Measures ANOVA. It is used to determine whether or not there is a statistically significant difference between the means of three or more groups in which the same subjects show up in each group.
This tutorial explains how to perform the Friedman Test in SPSS.
Example: The Friedman Test in SPSS
Researchers want to know if four different drugs lead to different reaction times. To test this, they measure the reaction time of five patients on the four different drugs.
Perform the following steps to conduct the Friedman Test in SPSS to determine if the reaction time differs between drugs.
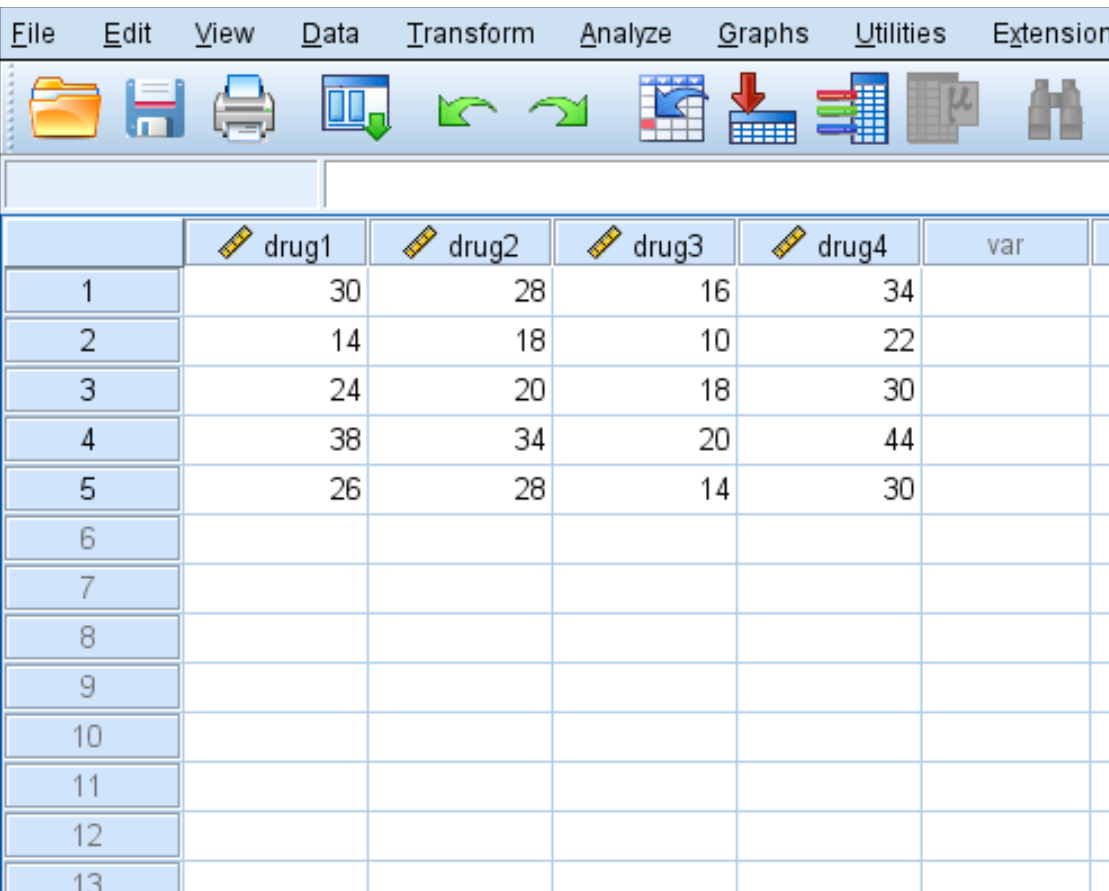
Step 1: Enter the data.
Enter the following data, which shows the response time (in seconds) of five patients on the four drugs:
Step 2: Perform the Friedman Test.
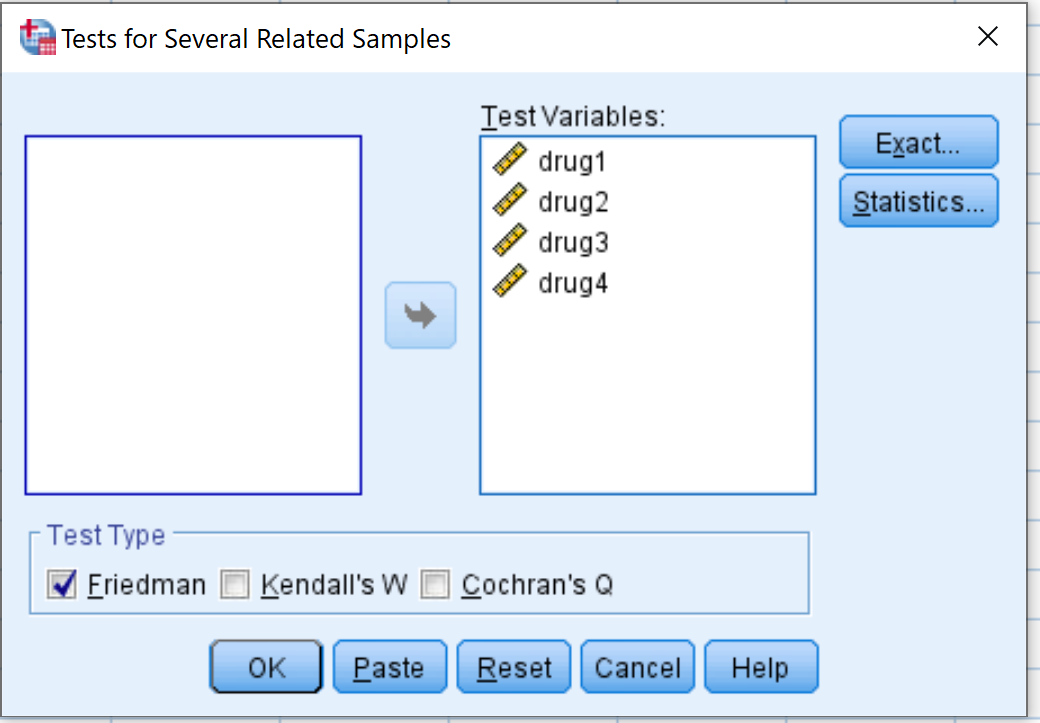
Click on the Analyze tab, then Nonparametric Tests, then Legacy Dialogs, then K Related Samples.

In the new window that pops up, drag all four of the drug variables into the box labelled Test Variables. Make sure the box is checked next to Friedman, then click OK.
Step 3: Interpret the results.
Once you click OK, the results of the Friedman Test will appear:
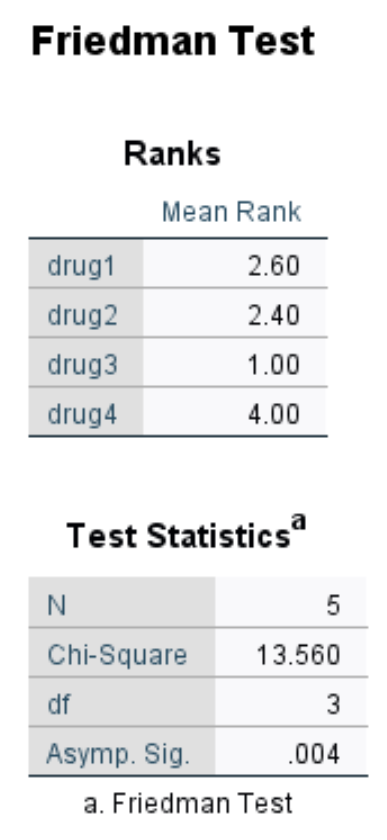
Here is how to interpret the output:
N: The total number of individuals in the dataset.
Chi-Square: The test statistic of the Friedman Test.
df: The degrees of freedom, calculated as #groups-1 = 4-1 = 3.
Asymp. Sig: The p-value associated with the test statistic with 3 degrees of freedom. In this case, the p-value is .004. This can also be calculated by using the Chi-Square Score to P Value Calculator.
Since the p-value is less than .05, we can reject the null hypothesis that the response time is the same for all four drugs. We have sufficient evidence to conclude that the type of drug used leads to statistically significant differences in response time.
Step 4: Report the results.
Lastly, we want to report the results of the test. Here is an example of how to do so:
A Friedman Test was conducted on five individuals to examine the effect that four different drugs had on response time. Each individual used each drug once.
Results showed that the type of drug used lead to statistically significant differences in response time (X2 = 13.56, p = 0.004).