A z-table is a table that tells you what percentage of values fall below a certain z-score in a standard normal distribution.
A z-score simply tells you how many standard deviations away an individual data value falls from the mean. It is calculated as:
z-score = (x – μ) / σ
where:
- x: individual data value
- μ: population mean
- σ: population standard deviation
This tutorial shows several examples of how to use the z table.
Example 1
The scores on a certain college entrance exam are normally distributed with mean μ = 82 and standard deviation σ = 8. Approximately what percentage of students score less than 84 on the exam?
Step 1: Find the z-score.
First, we will find the z-score associated with an exam score of 84:
z-score = (x – μ) / σ = (84 – 82) / 8 = 2 / 8 = 0.25
Step 2: Use the z-table to find the percentage that corresponds to the z-score.
Next, we will look up the value 0.25 in the z-table:
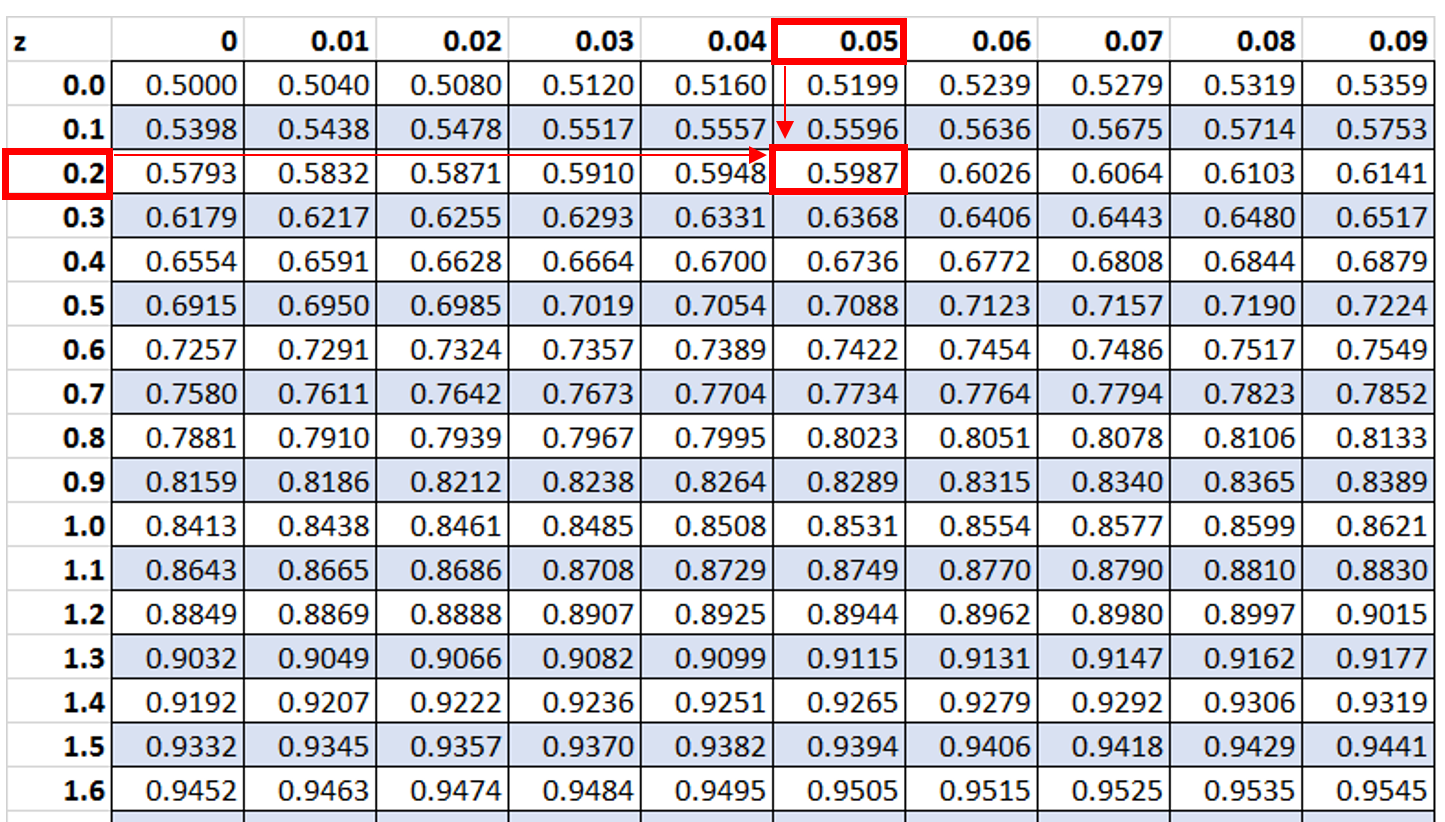
Approximately 59.87% of students score less than 84 on this exam.
Example 2
The height of plants in a certain garden are normally distributed with a mean of μ = 26.5 inches and a standard deviation of σ = 2.5 inches. Approximately what percentage of plants are greater than 26 inches tall?
Step 1: Find the z-score.
First, we will find the z-score associated with a height of 26 inches.
z-score = (x – μ) / σ = (26 – 26.5) / 2.5 = -0.5 / 2.5 = -0.2
Step 2: Use the z-table to find the percentage that corresponds to the z-score.
Next, we will look up the value -0.2 in the z-table:
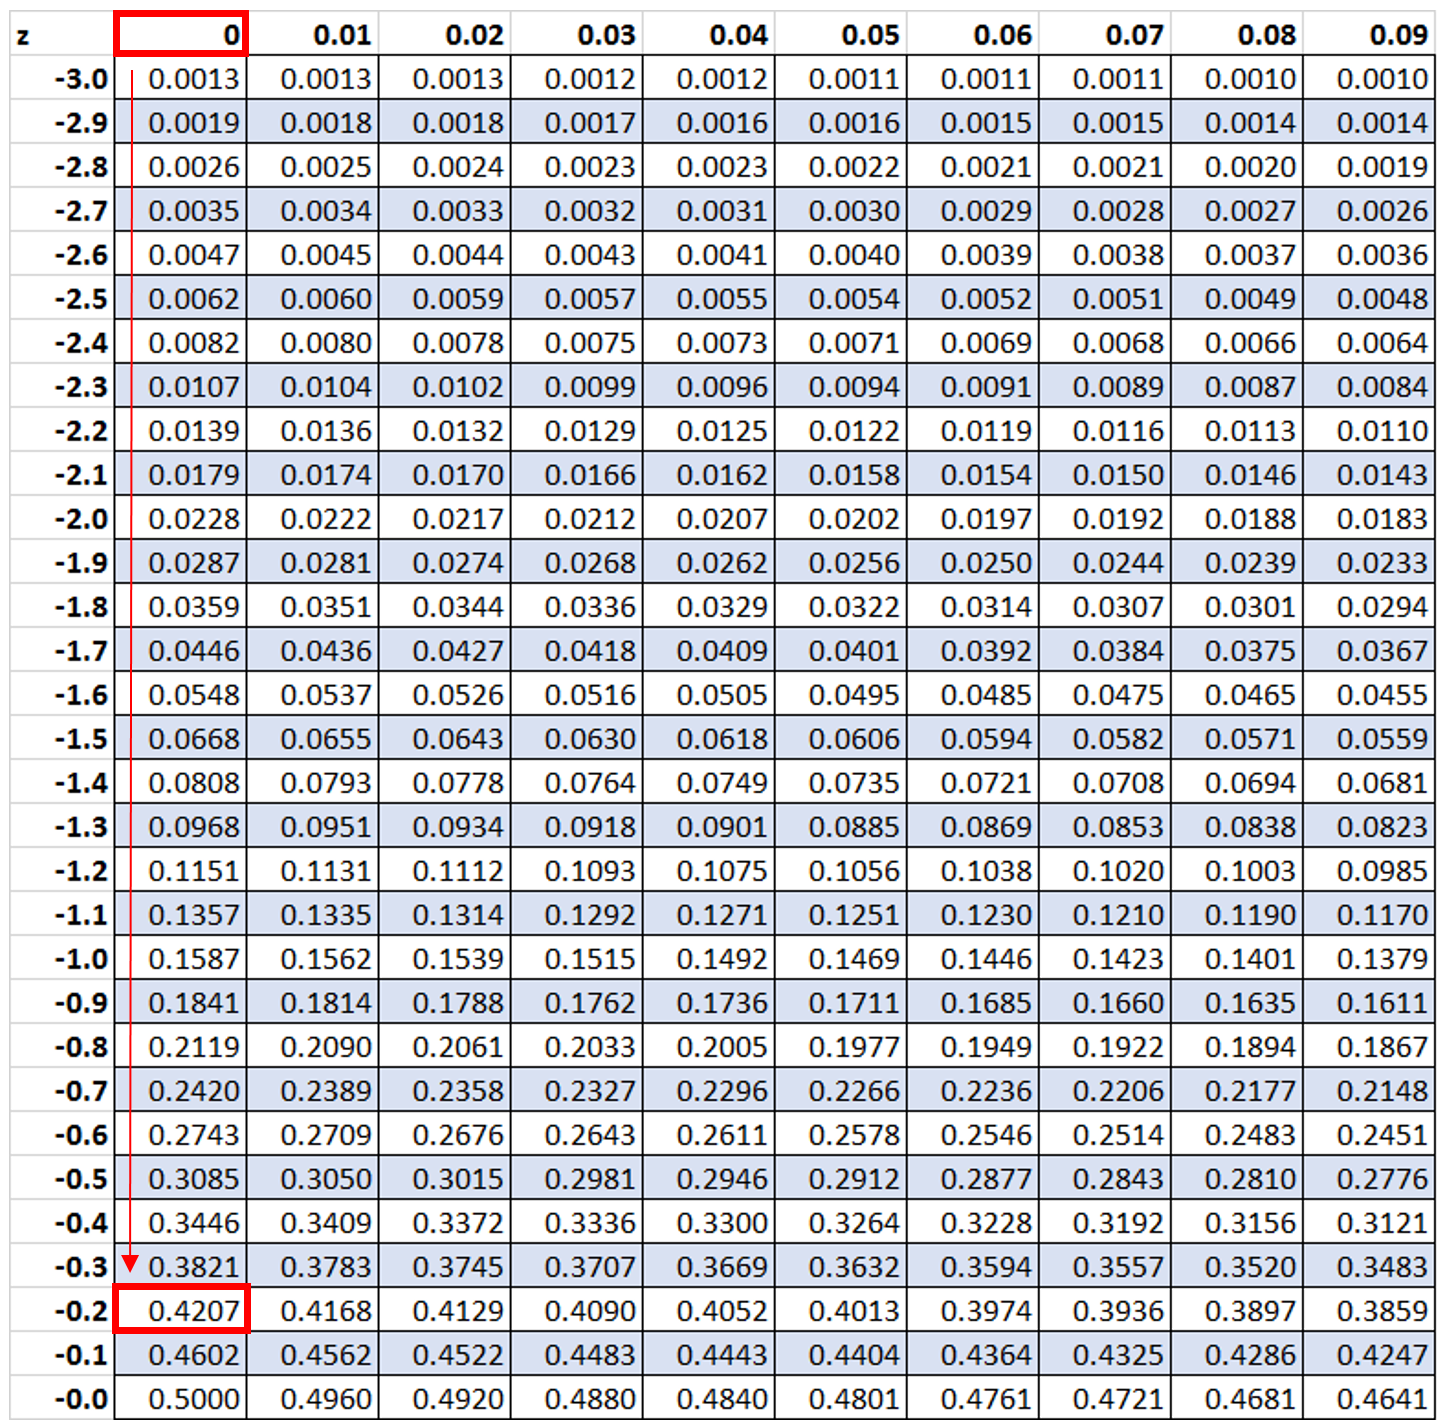
We see that 42.07% of values fall below a z-score of -0.2. However, in this example we want to know what percentage of values are greater than -0.2, which we can find by using the formula 100% – 42.07% = 57.93%.
Thus, aproximately 59.87% of the plants in this garden are greater than 26 inches tall.
Example 3
The weight of a certain species of dolphin is normally distributed with a mean of μ = 400 pounds and a standard deviation of σ = 25 pounds. Approximately what percentage of dolphins weigh between 410 and 425 pounds?
Step 1: Find the z-scores.
First, we will find the z-scores associated with 410 pounds and 425 pounds
z-score of 410 = (x – μ) / σ = (410 – 400) / 25 = 10 / 25 = 0.4
z-score of 425 = (x – μ) / σ = (425 – 400) / 25 = 25 / 25 = 1
Step 2: Use the z-table to find the percentages that corresponds to each z-score.
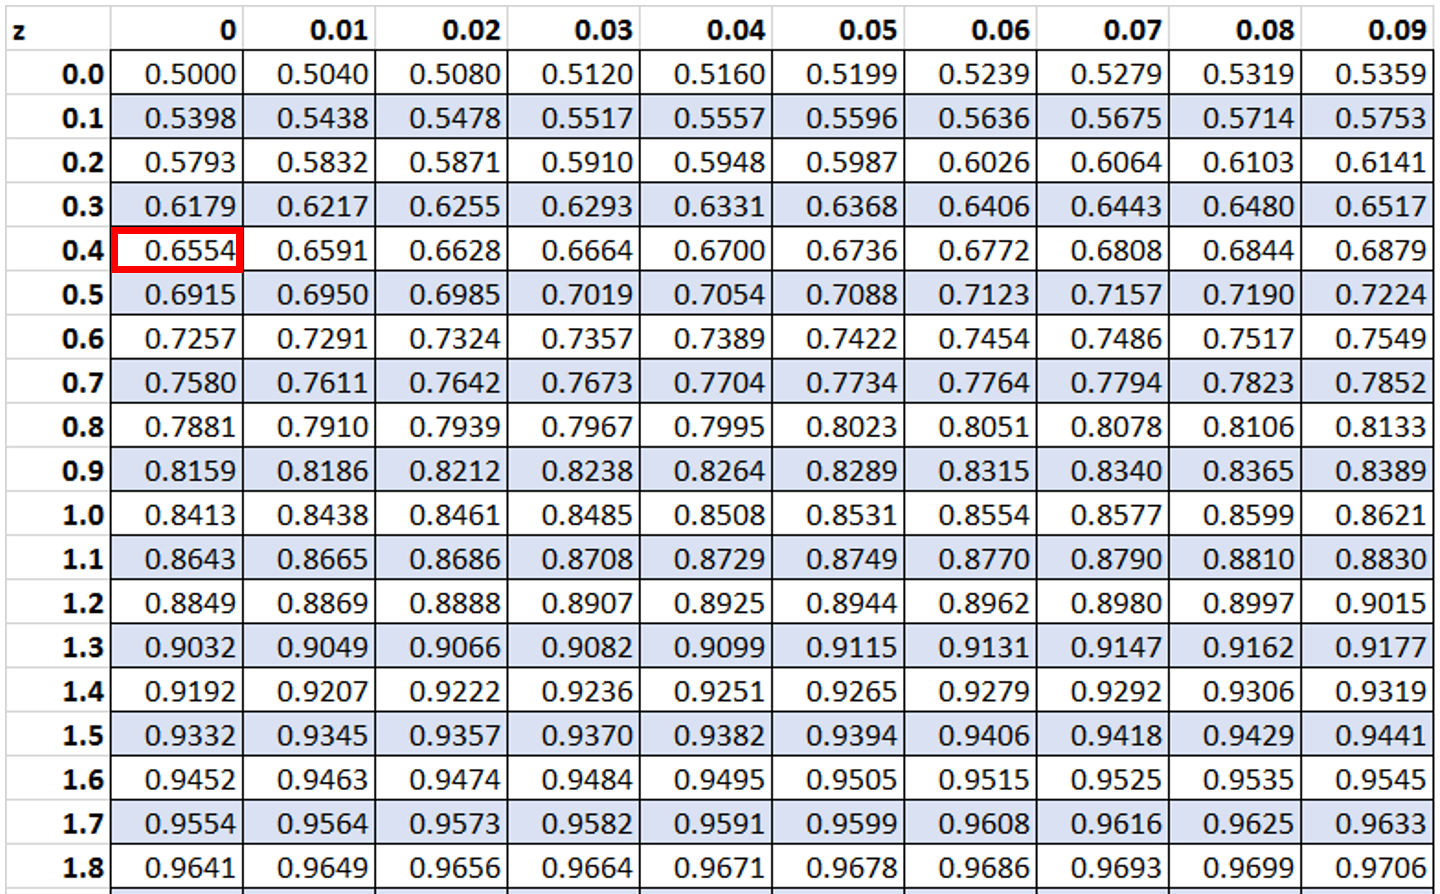
First, we will look up the value 0.4 in the z-table:
Then, we will look up the value 1 in the z-table:
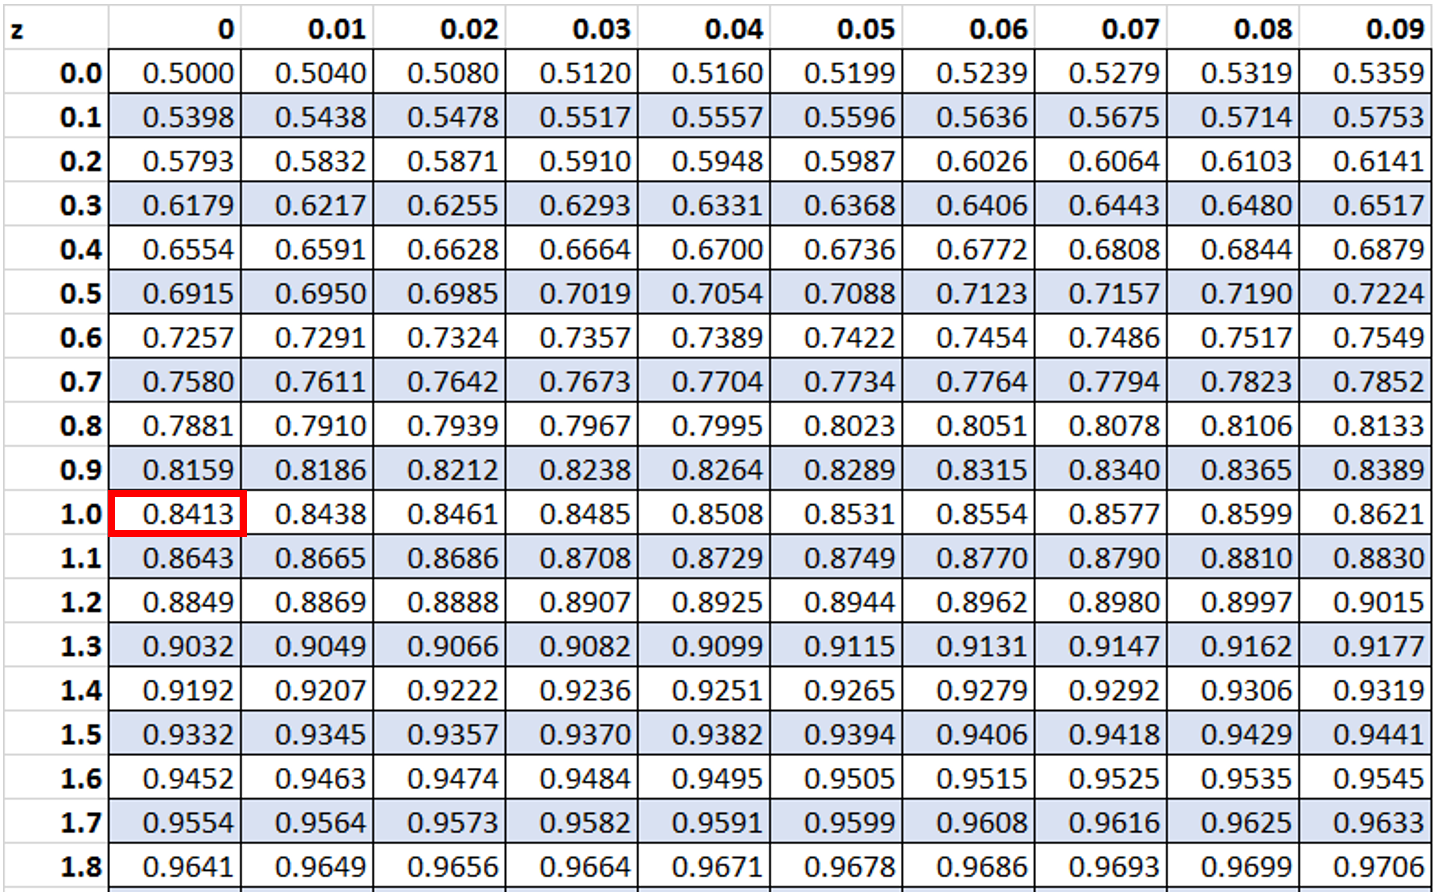
Lastly, we will subtract the smaller value from the larger value: 0.8413 – 0.6554 = 0.1859.
Thus, approximately 18.59% of dolphins weigh between 410 and 425 pounds.
Additional Resources
An Introduction to the Normal Distribution
Normal Distribution Area Calculator
Z Score Calculator