The interquartile range, often denoted IQR, is a way to measure the spread of the middle 50% of a dataset.
It is calculated as the difference between the first quartile (Q1) and the third quartile (Q3) of a dataset.
Note that quartiles are simply values that split up a dataset into four equal parts.
The IQR is often used to measure the spread of values in a dataset because it’s known to be resistant to outliers. Since it only tells us the spread of the middle 50% of the dataset, it isn’t affect by unusually small or unusually large values.
This makes it a preferable way to measure dispersion compared to a metric like the range, which simply tells us the difference between the largest and the smallest values in a dataset.
The following step-by-step example shows how to calculate the IQR for the following dataset on a TI-84 calculator:
Dataset: 4, 6, 6, 7, 8, 12, 15, 17, 20, 21, 21, 23, 24, 27, 28
Step 1: Enter the Data
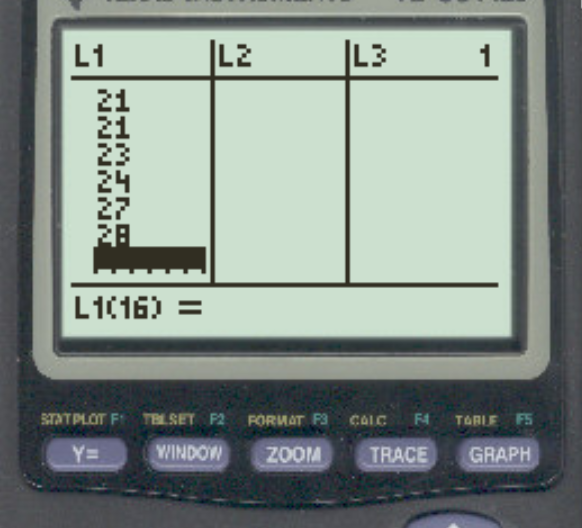
First, we will enter the data values.
Press Stat, then press EDIT. Then enter the values of the dataset in column L1:
Step 2: Find the Interquartile Range
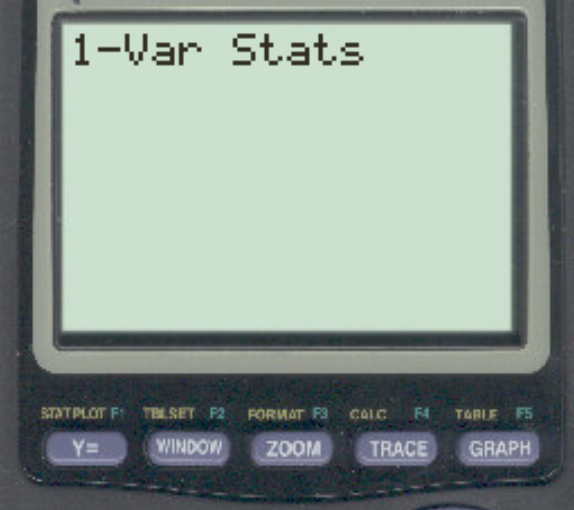
Next, press Stat and then scroll over to the right and press CALC.
Then press 1-Var Stats.

In the new screen that appears, press Enter.
Once you press Enter, a list of summary statistics will appear. Scroll down to the very bottom of the list:
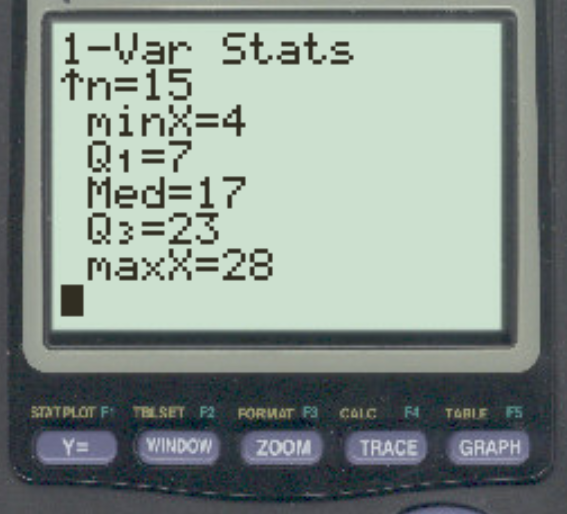
From this screen we can observe the values for the first quartile (Q1) and the third quartile (Q3) of the dataset:
- First quartile (Q1): 7
- Third quartile (Q3): 23
The interquartile range is calculated as Q3 – Q1, which would be 23 – 7 = 16.
This tells us that the spread of the middle 50% of values in the dataset is 16.
Additional Resources
How to Perform a One Sample t-test on a TI-84 Calculator
How to Perform a Two Sample t-test on a TI-84 Calculator
How to Calculate Confidence Intervals on a TI-84 Calculator