A two sample t-test is used to test whether or not the means of two populations are equal.
This tutorial explains how to conduct a two sample t-test on a TI-84 calculator.
Example: Two Sample t-test on a TI-84 Calculator
Researchers want to know if a new fuel treatment leads to a change in the average mpg of a certain car. To test this, they conduct an experiment in which 12 cars receive the new fuel treatment and 12 cars do not. For the control group, the mean mpg is 21 mpg and the standard deviation is 2.73 mpg. For the treatment group, the mean mpg is 22.75 mpg and the standard deviation is 3.25 mpg.
Use this data to perform a two sample t-test to determine if the average mpg is different between the two groups.
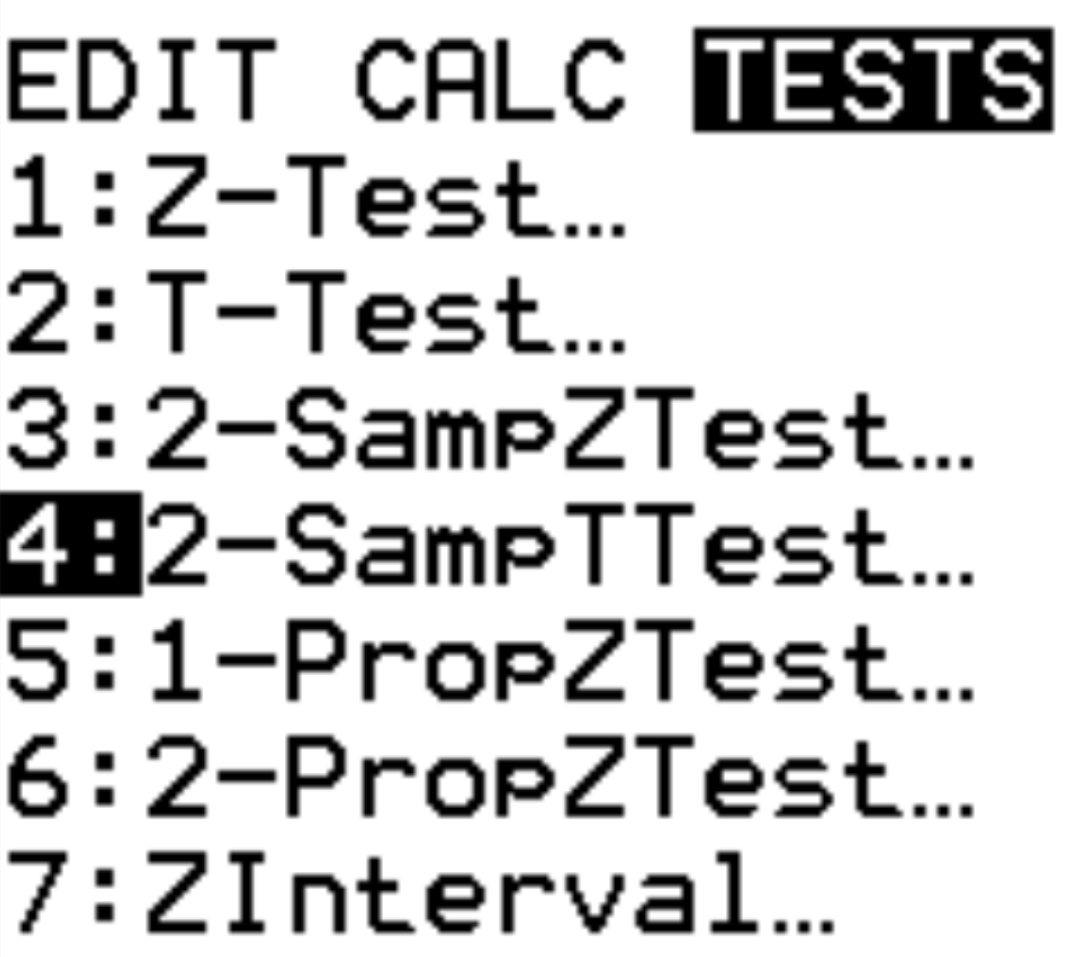
Step 1: Select 2-SampTTest.
Press Stat. Scroll over to TESTS. Scroll down to 2-SampTTest and press ENTER.
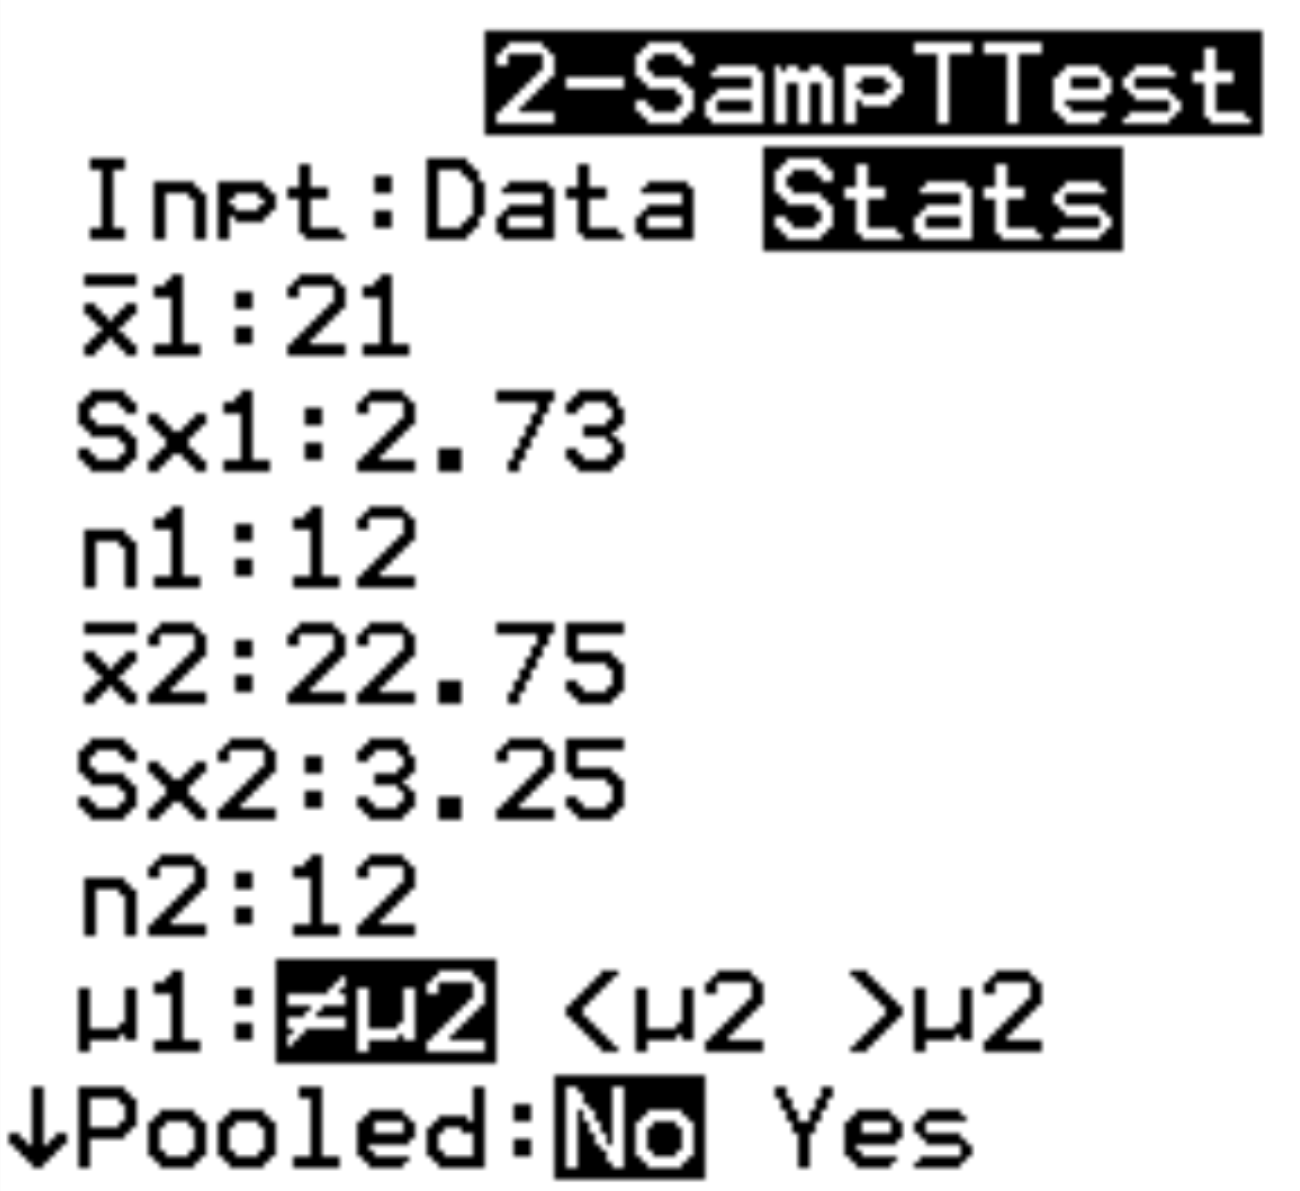
Step 2: Fill in the necessary info.
The calculator will ask for the following information:
- Inpt: Choose whether you are working with raw data (Data) or summary statistics (Stats). In this case, we will highlight Stats and press ENTER.
- x1: The sample mean of the first group. We will type 21 and press ENTER.
- Sx1: The sample standard deviation of the first group. We will type 2.73 and press ENTER.
- n1: The sample size of the first group. We will type 12 and press ENTER.
- x2: The sample mean of the second group. We will type 22.75 and press ENTER.
- Sx2: The sample standard deviation of the second group. We will type 3.25 and press ENTER.
- n2: The sample size of the second group. We will type 12 and press ENTER.
- μ1:The alternative hypothesis to be used. Since we are performing a two-tailed test, we will highlight ≠μ2 and press ENTER. This indicates that our alternative hypothesis is μ1≠μ2. The other two options would be used for left-tailed tests (μ1μ2) .
- Pooled: Choose whether you want to pool the variances of the two groups or not. In most cases, we will choose no. Highlight no and press ENTER.
Lastly, highlight Calculate and press ENTER.
Step 3: Interpret the results.
Our calculator will automatically produce the results of the two sample t-test:
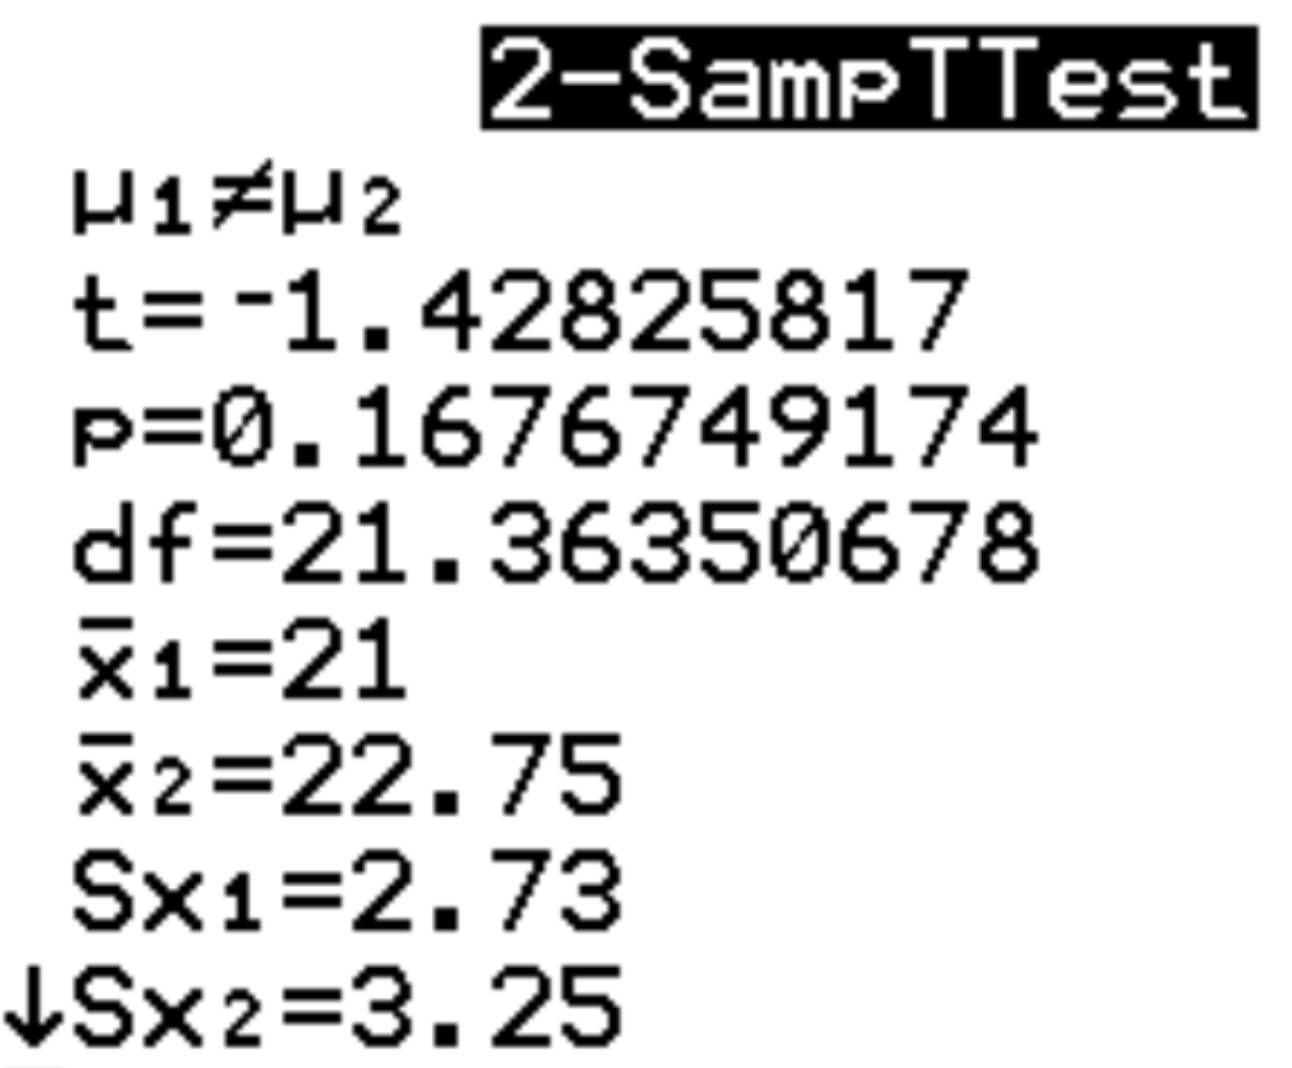
Here is how to interpret the results:
- μ1≠μ2: This is the alternative hypothesis for the test.
- t=-1.42825817: This is the t test statistic.
- p=0.1676749174: This is the p-value that corresponds to the test statistic.
- df=21.36350678: This is the degrees of freedom used to calculate the test statistic.
- x1=21. This is the sample mean that we entered for the first group.
- x2=22.75: This is the sample mean that we entered for the second group.
- Sx1=2.73. This is the sample standard deviation that we entered for the first group.
- Sx2=3.25: This is the sample standard deviation that we entered for the second group.
- n1=12: This is the sample size we entered for the first group.
- n2=12: This is the sample size we entered for the second group.
Because the p-value of the test (0.1676749174) is not less than 0.05, we fail to reject the null hypothesis. This means we do not have sufficient evidence to say that the mean mpg is different between the two groups.