A one sample t-test is used to test whether or not the mean of a population is equal to some value.
This tutorial explains how to conduct a one sample t-test on a TI-84 calculator.
Example: One Sample t-test on a TI-84 Calculator
Researchers want to know if a certain type of car gets 20 miles per gallon or not. They obtain a random sample of 74 cars and find that the mean is 21.29 mpg while the standard deviation is 5.78 mpg. Use this data to perform a one sample t-test to determine if the true mpg for this type of car is equal to 20 mpg.
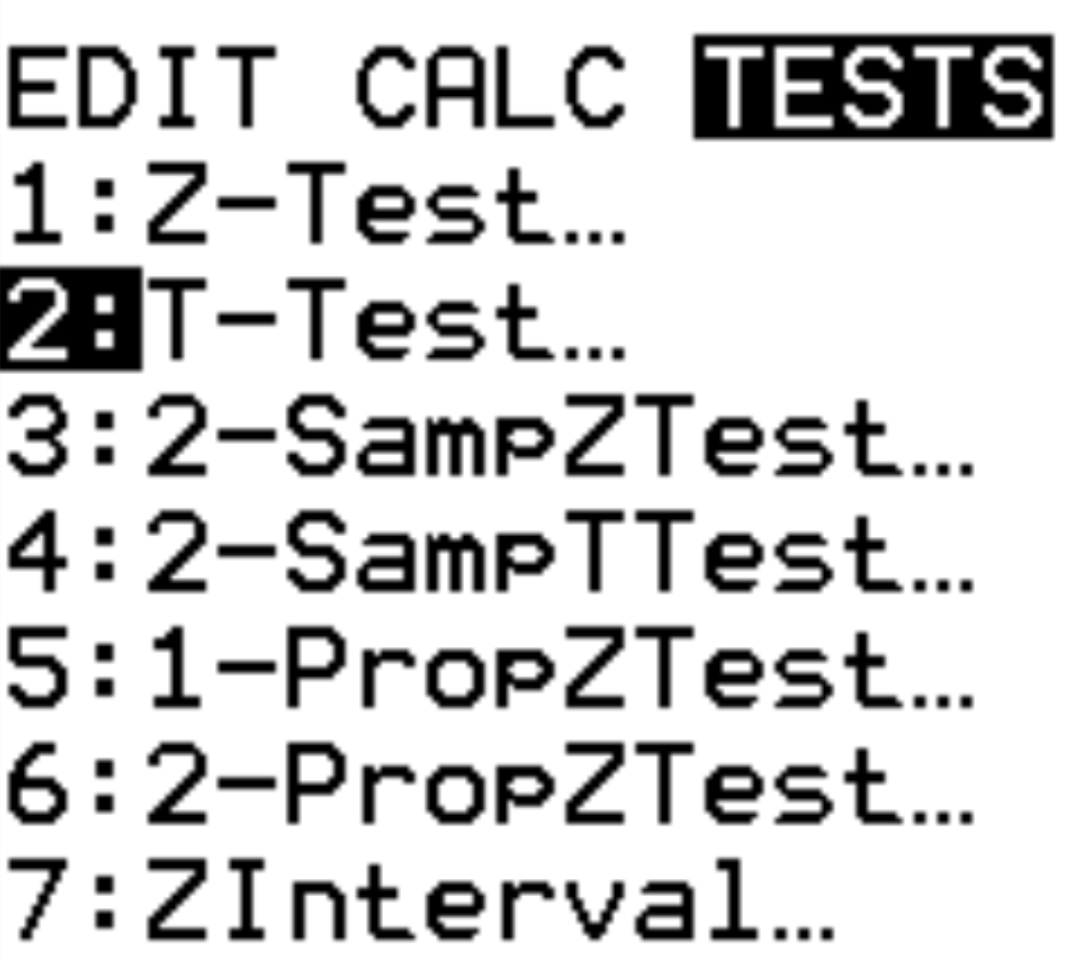
Step 1: Select T-Test.
Press Stat. Scroll over to TESTS. Scroll down to T-Test and press ENTER.
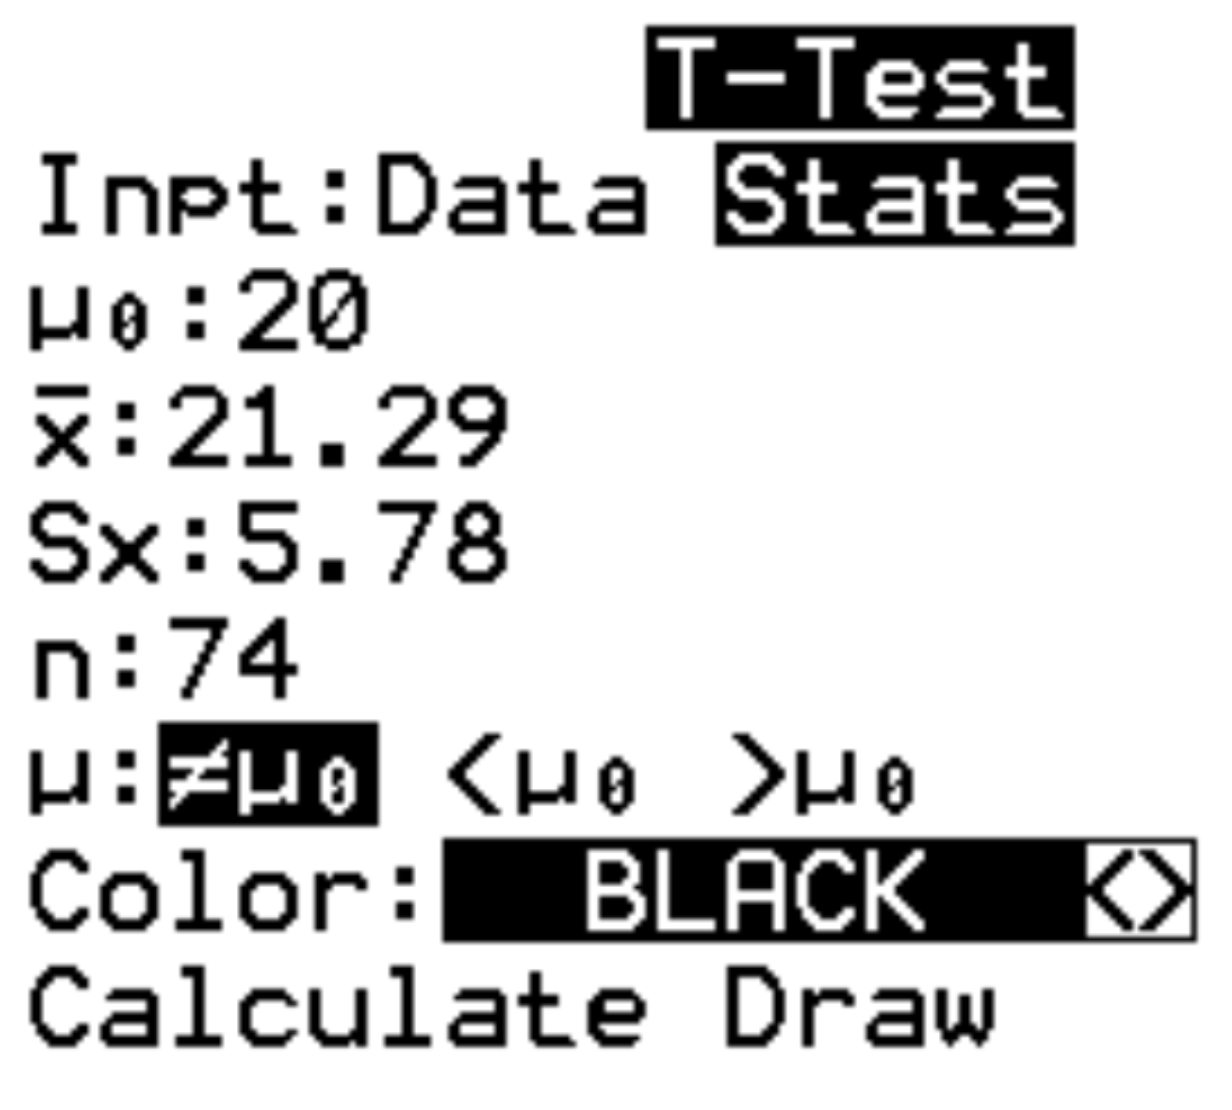
Step 2: Fill in the necessary info.
The calculator will ask for the following information:
- Inpt: Choose whether you are working with raw data (Data) or summary statistics (Stats). In this case, we will highlight Stats and press ENTER.
- μ0: The mean to be used in the null hypothesis. We will type 20 and press ENTER.
- x: The sample mean. We will type 21.29 and press ENTER.
- sx: The sample standard deviation. We will type 5.78 and press ENTER.
- n: The sample size. We will type 74 and press ENTER.
- μ:The alternative hypothesis to be used. Since we are performing a two-tailed test, we will highlight ≠μ0 and press ENTER. This indicates that our alternative hypothesis is μ≠20. The other two options would be used for left-tailed tests (0) and right-tailed tests (>μ0) .
Lastly, highlight Calculate and press ENTER.
Step 3: Interpret the results.
Our calculator will automatically produce the results of the one-sample t-test:
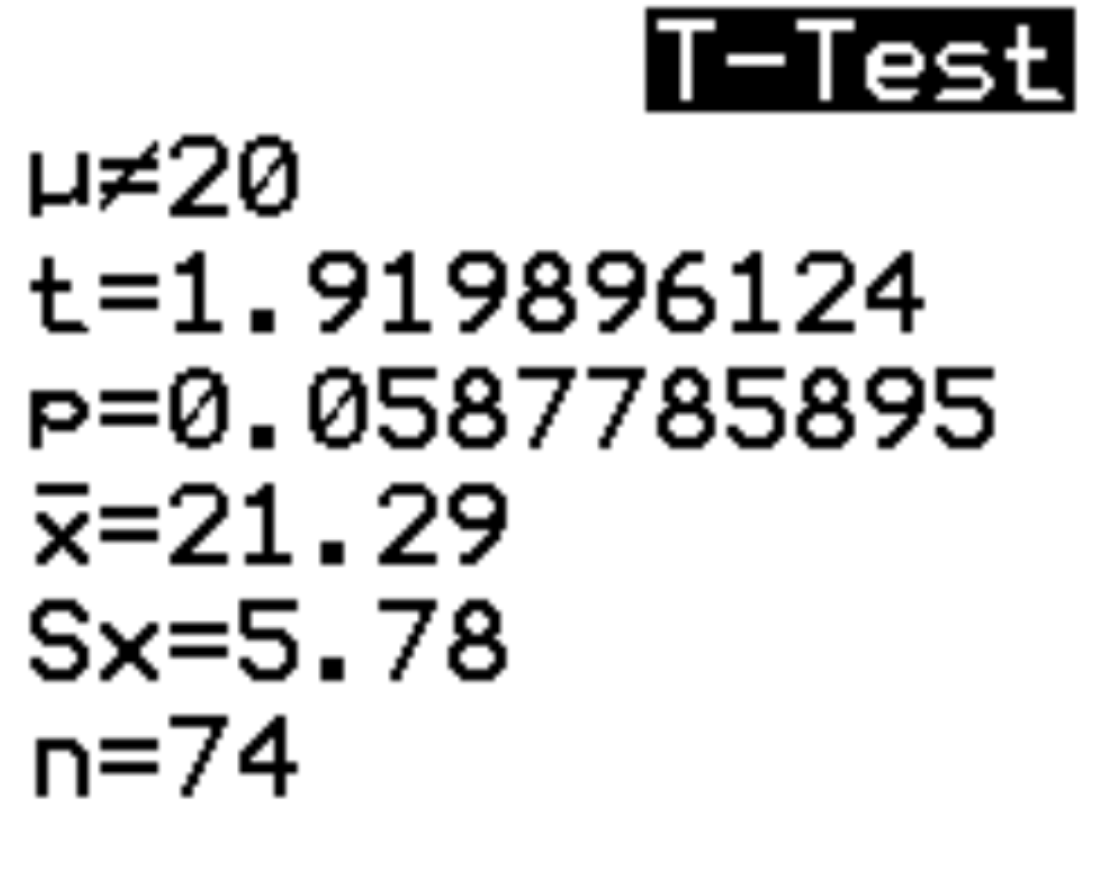
Here is how to interpret the results:
- μ≠20: This is the alternative hypothesis for the test.
- t=1.919896124: This is the t test-statistic.
- p=0.0587785895: This is the p-value that corresponds to the test-statistic.
- x=21.59. This is the sample mean that we entered.
- sx=5.78. This is the sample standard deviation that we entered.
- n=74: This is the sample size that we entered.
Because the p-value of the test (0.0587785895) is not less than 0.05, we fail to reject the null hypothesis. This means we do not have sufficient evidence to say that the mean mpg for this type of car is different from 20 mpg.