A confidence interval (C.I.) is a range of values that is likely to include a population parameter with a certain degree of confidence.
This tutorial explains how to calculate the following confidence intervals on a TI-84 calculator:
- Confidence interval for a population mean; σ known
- Confidence interval for a population mean; σ unknown
- Confidence interval for a population proportion
Example 1: C.I. for a population mean; σ known
Find a 95% confidence interval for a population mean, given the following information:
- sample mean x = 14
- sample size n = 35
- population standard deviation = 4
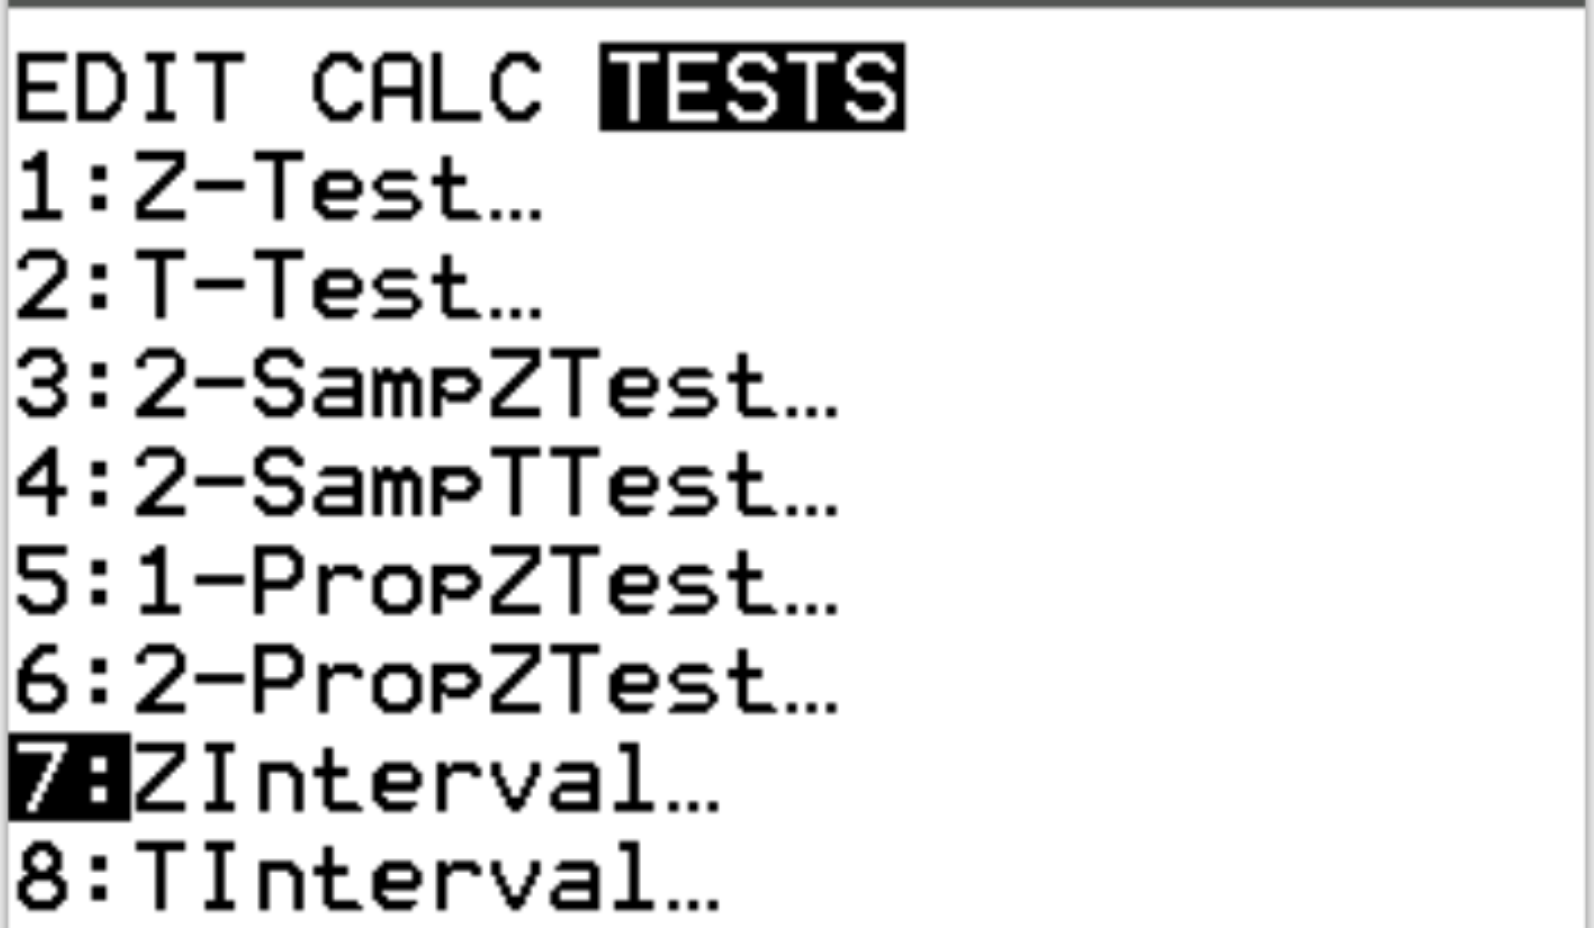
Step 1: Choose Z Interval.
Press Stat and then scroll over to TESTS. Highlight 7:ZInterval and press Enter.
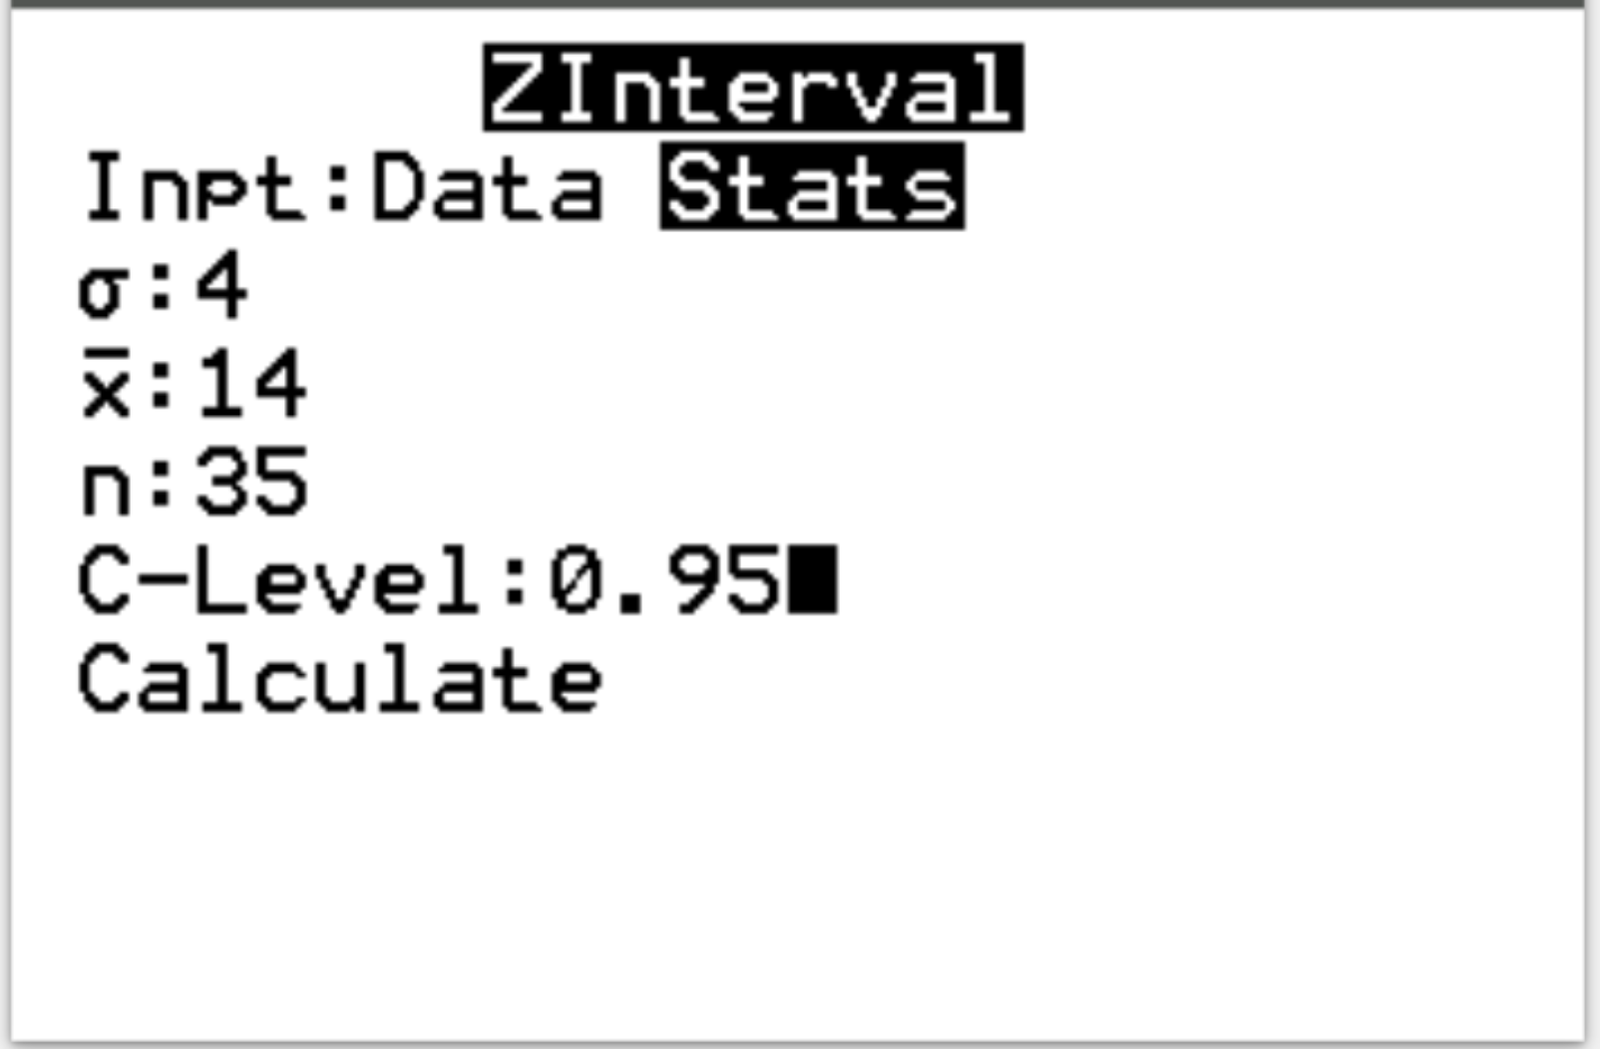
Step 2: Fill in the necessary information.
The calculator will ask for the following information:
- Inpt: Choose whether you are working with raw data (Data) or summary statistics (Stats). In this case, we will highlight Stats and press ENTER.
- σ: The population standard deviation. We will type 4 and press ENTER.
- x: The sample mean. We will type 14 and press ENTER.
- n: The sample size. We will type 35 and press ENTER.
- C-level:The confidence level We will type 0.95 and press ENTER.
Lastly, highlight Calculate and press ENTER.
Step 3: Interpret the results.
Once you press ENTER, the 95% confidence interval for the population mean will be displayed:
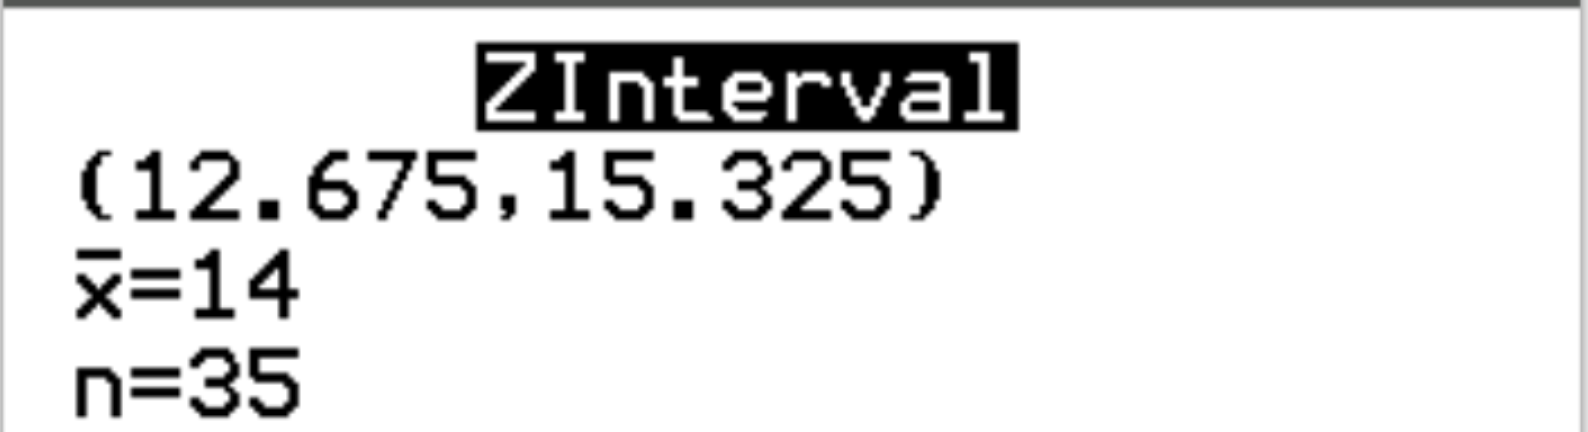
The 95% confidence interval for the population mean is (12.675, 15.325).
Example 2: C.I. for a population mean; σ unknown
Find a 95% confidence interval for a population mean, given the following information:
- sample mean x = 12
- sample size n = 19
- sample standard deviation = 6.3
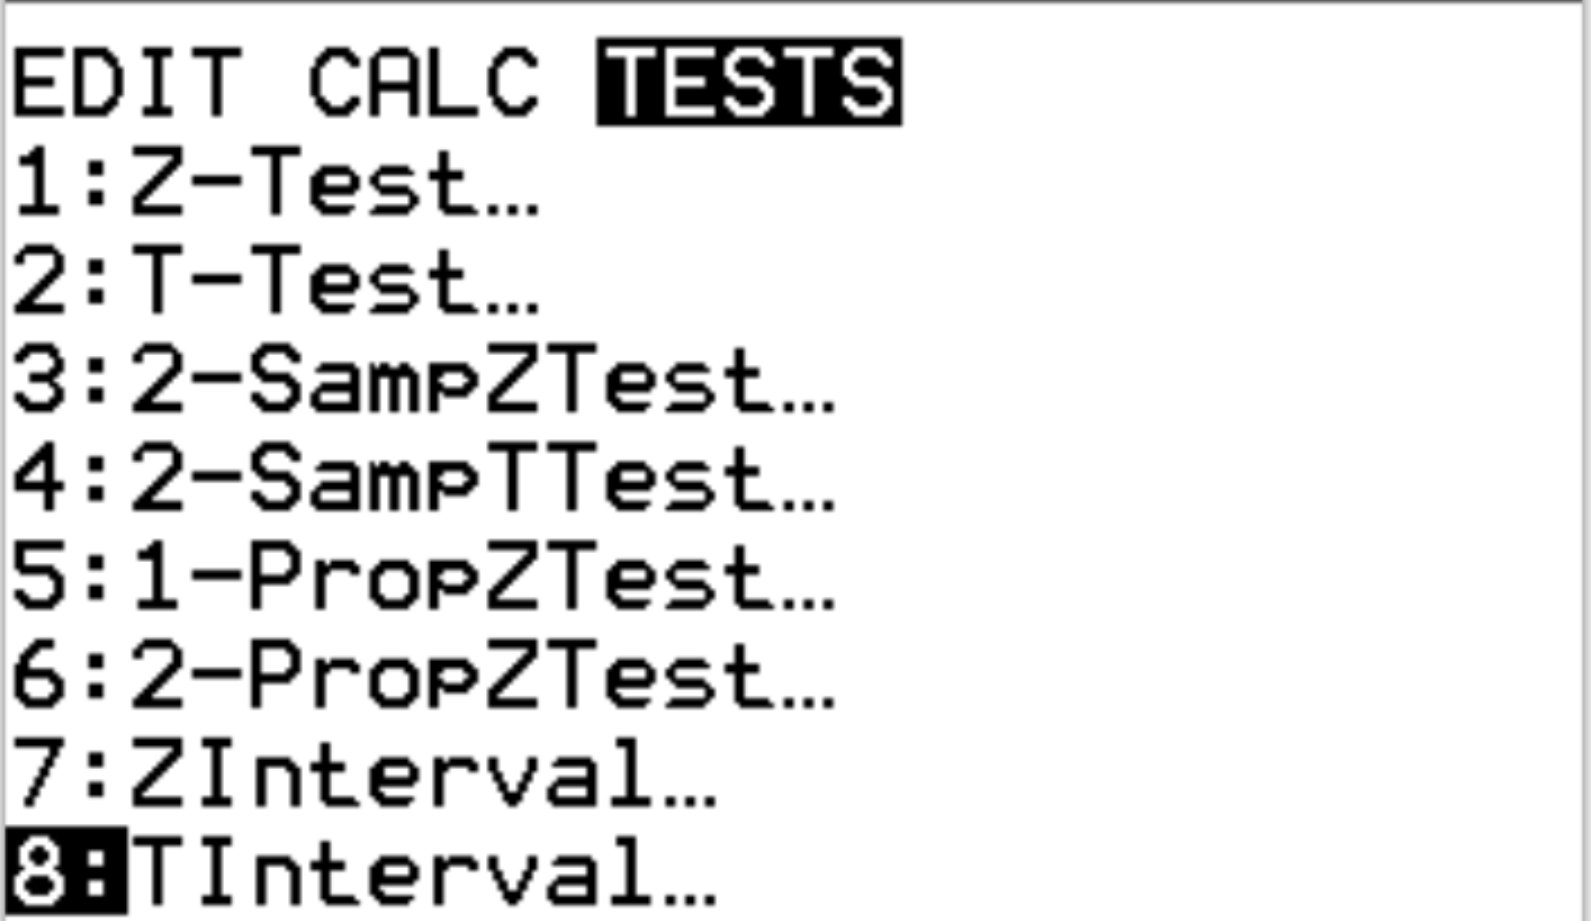
Step 1: Choose T Interval.
Press Stat and then scroll over to TESTS. Highlight 8:TInterval and press Enter.
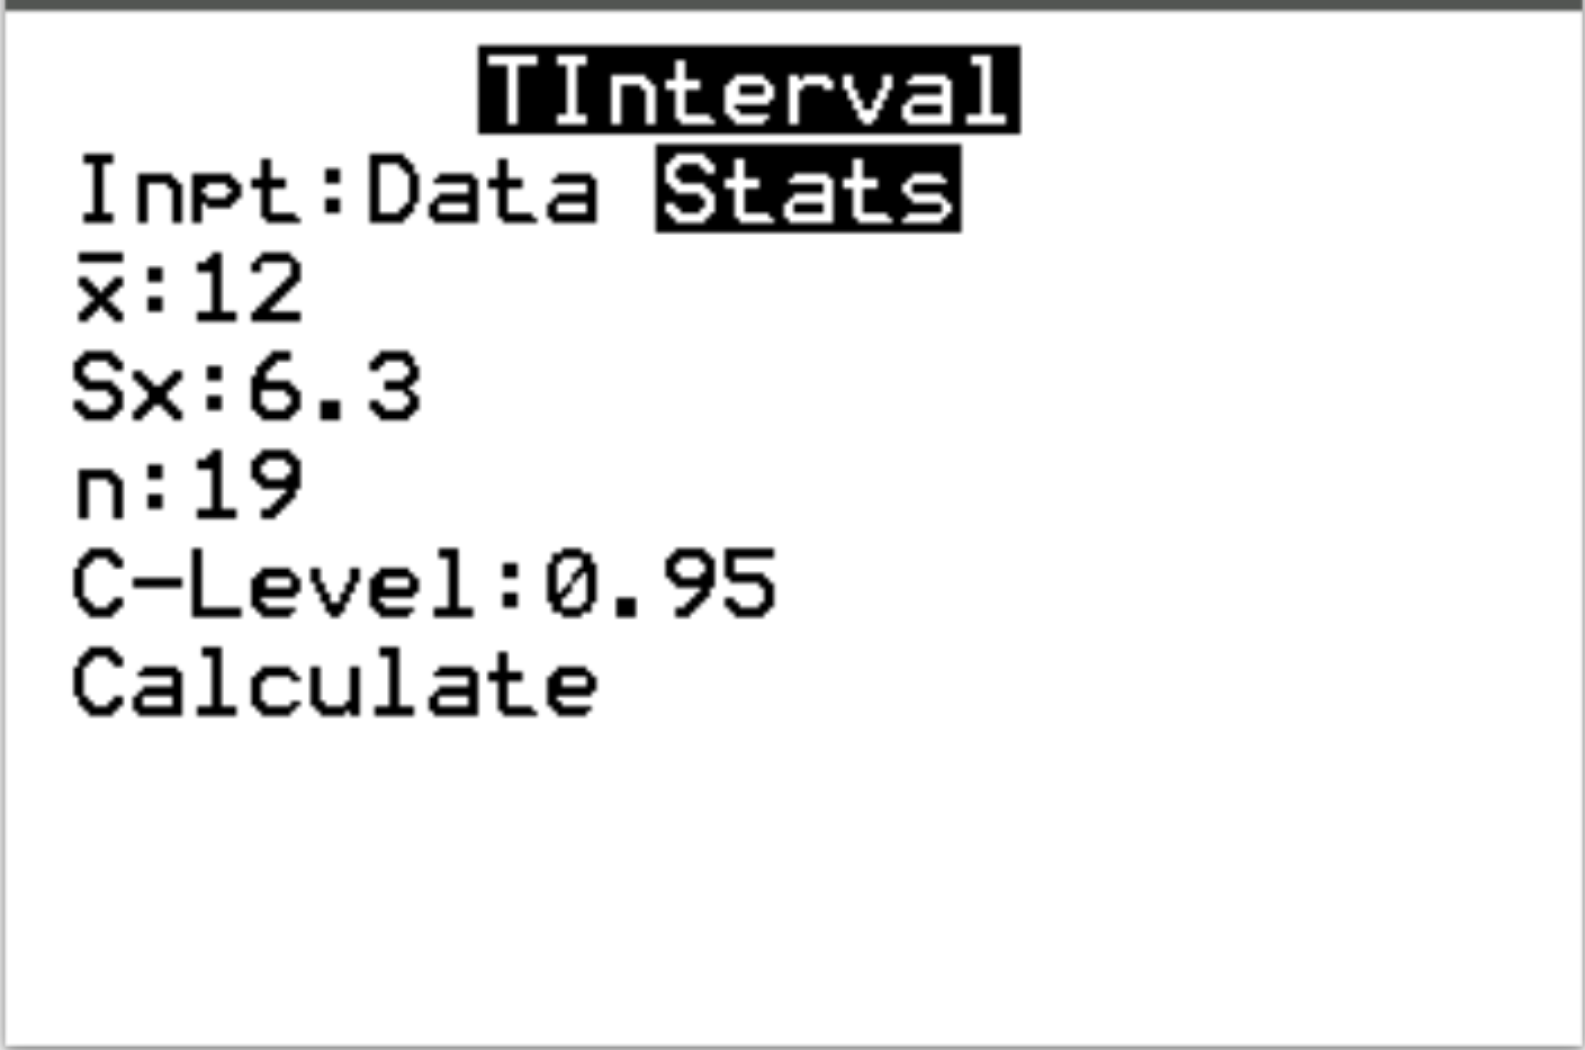
Step 2: Fill in the necessary information.
The calculator will ask for the following information:
- Inpt: Choose whether you are working with raw data (Data) or summary statistics (Stats). In this case, we will highlight Stats and press ENTER.
- x: The sample mean. We will type 12 and press ENTER.
- Sx: The sample standard deviation. We will type 6.3 and press ENTER.
- n: The sample size. We will type 19 and press ENTER.
- C-level:The confidence level We will type 0.95 and press ENTER.
Lastly, highlight Calculate and press ENTER.
Step 3: Interpret the results.
Once you press ENTER, the 95% confidence interval for the population mean will be displayed:
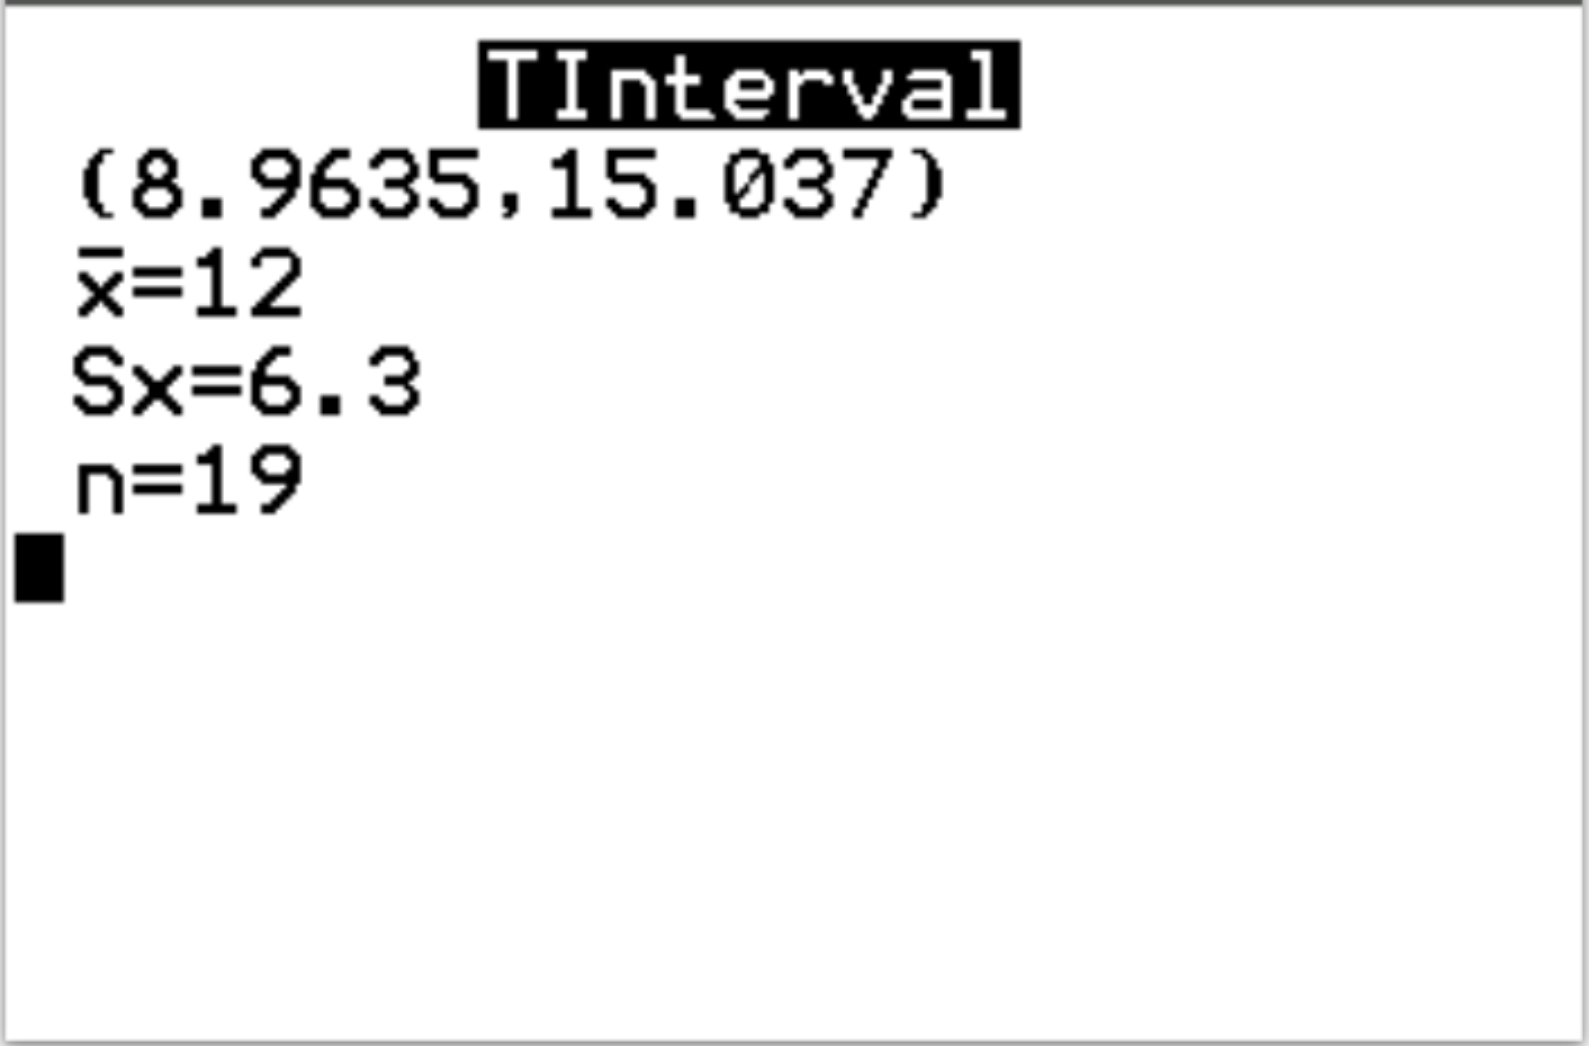
The 95% confidence interval for the population mean is (8.9635, 15.037).
Example 3: C.I. for a population proportion
Find a 95% confidence interval for a population proportion, given the following information:
- number of “successes” (x) = 12
- number of trials (n) = 19
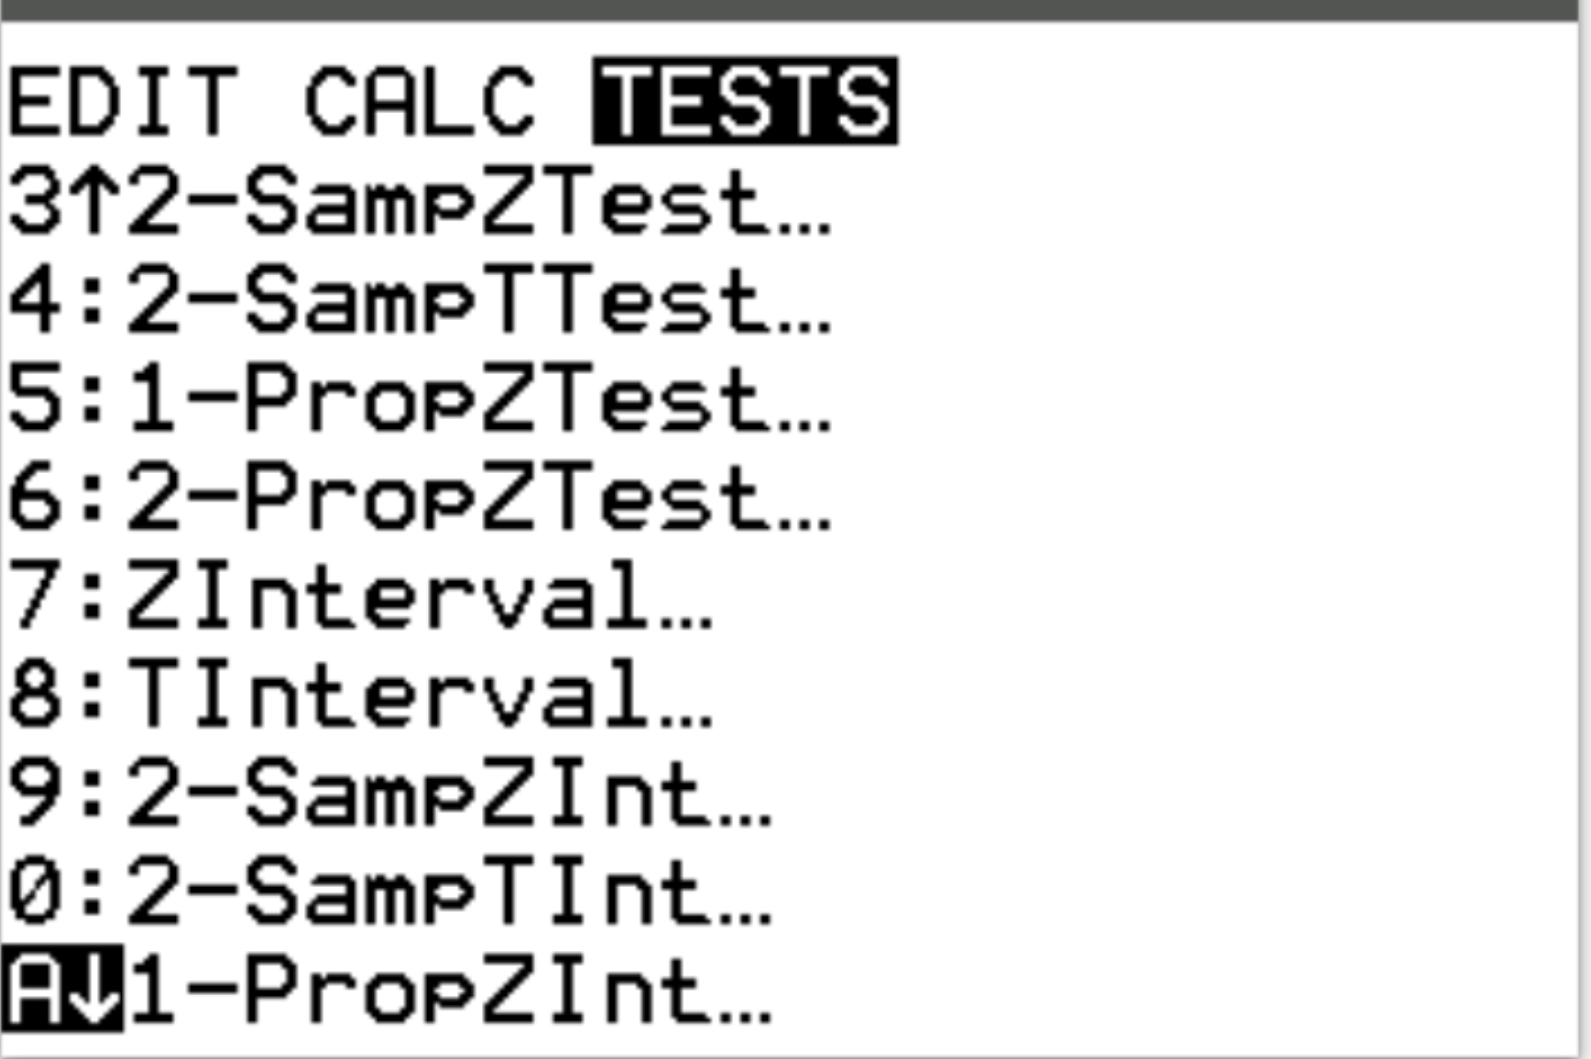
Step 1: Choose 1 Proportion Z Interval.
Press Stat and then scroll over to TESTS. Highlight 1-PropZInt and press Enter.
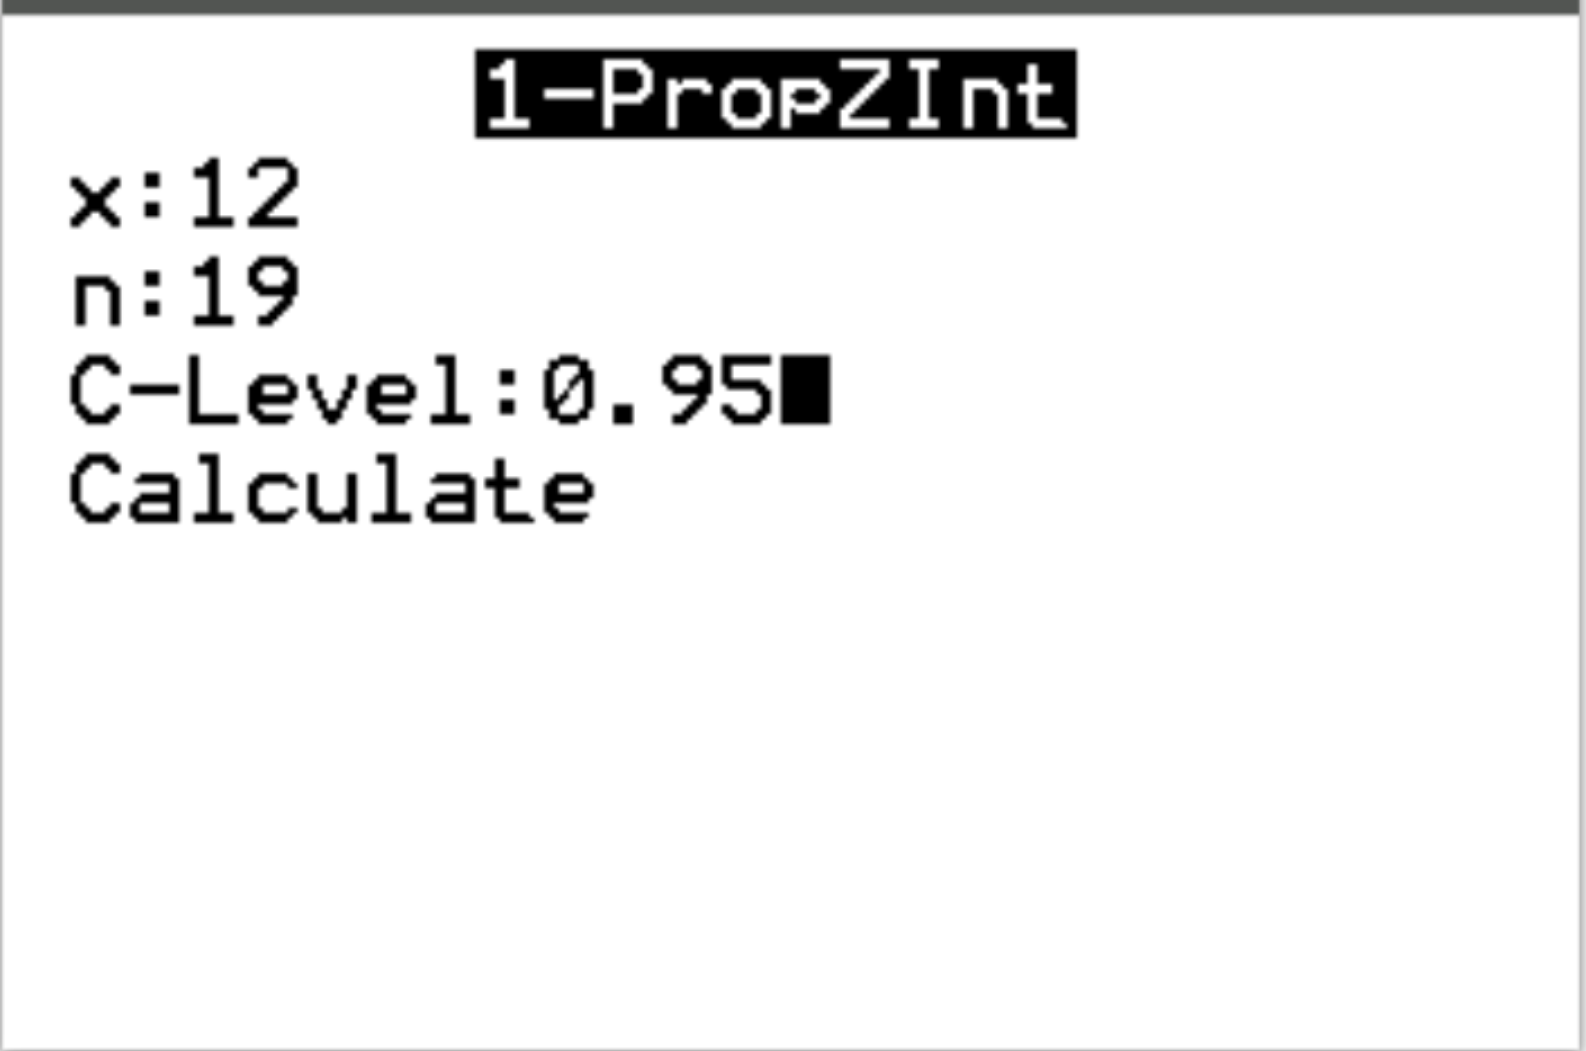
Step 2: Fill in the necessary information.
The calculator will ask for the following information:
- x: The number of successes. We will type 12 and press ENTER.
- n: The number of trials. We will type 19 and press ENTER.
- C-level:The confidence level We will type 0.95 and press ENTER.
Lastly, highlight Calculate and press ENTER.
Step 3: Interpret the results.
Once you press ENTER, the 95% confidence interval for the population proportion will be displayed:
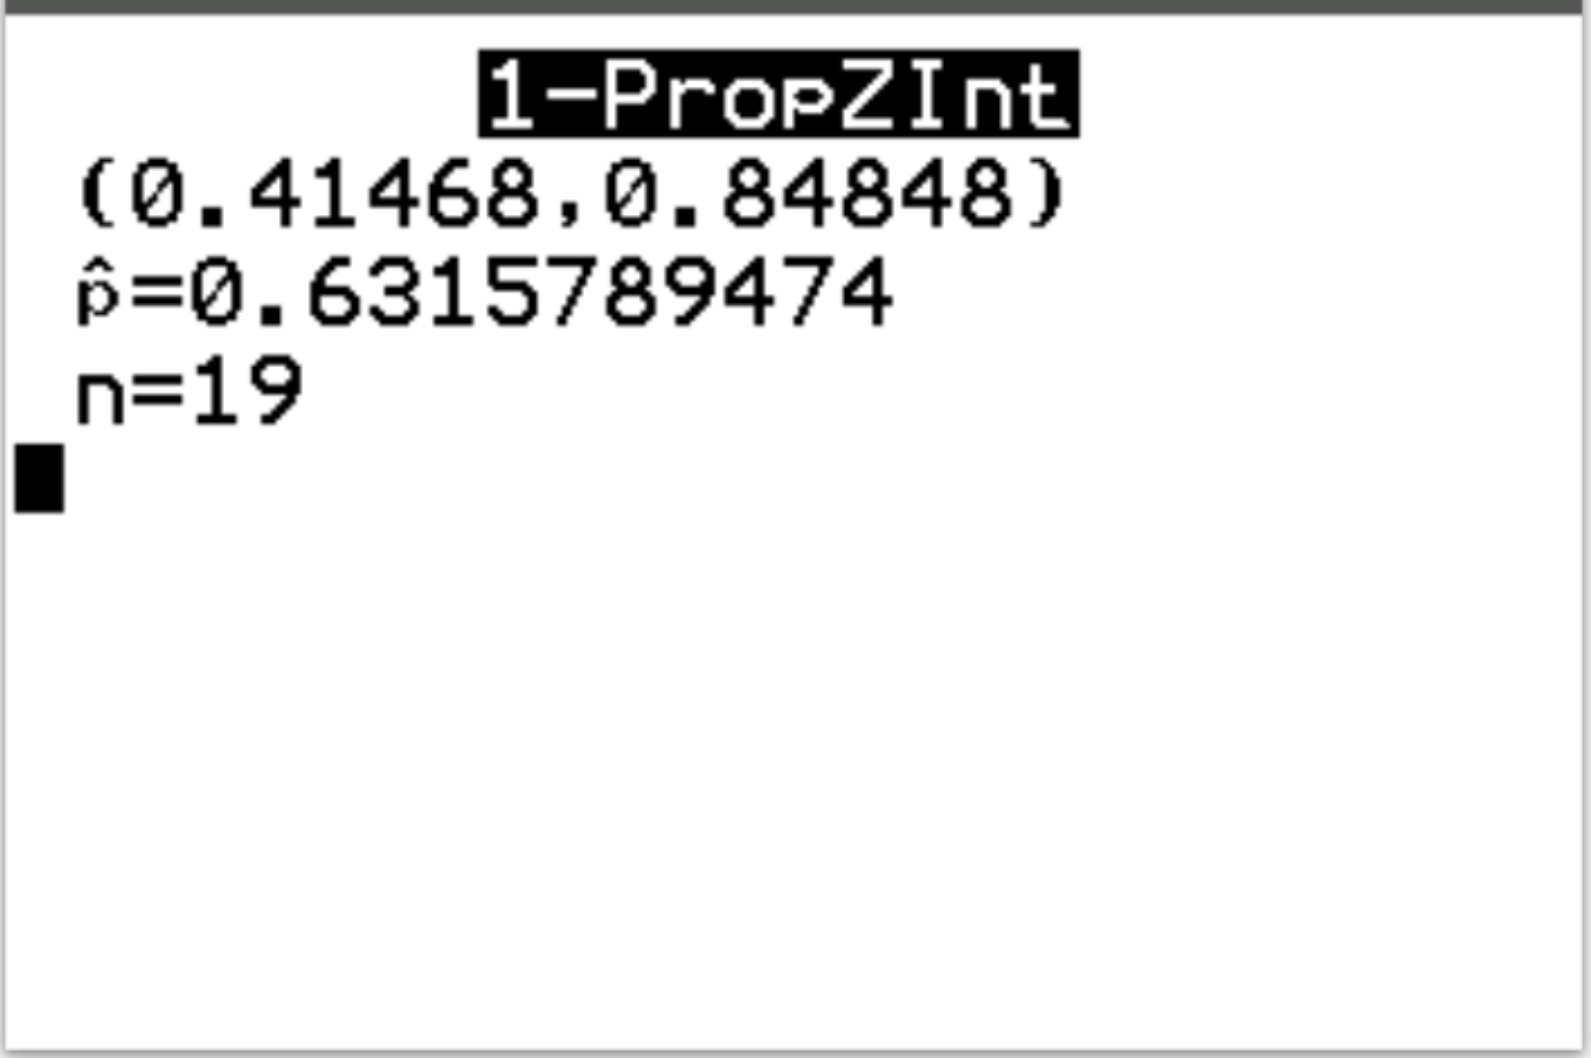
The 95% confidence interval for the population proportion is (0.41468, 0.84848).