Residual variance (sometimes called “unexplained variance”) refers to the variance in a model that cannot be explained by the variables in the model.
The higher the residual variance of a model, the less the model is able to explain the variation in the data.
Residual variance appears in the output of two different statistical models:
1. ANOVA: Used to compare the means of three or more independent groups.
2. Regression: Used to quantify the relationship between one or more predictor variables and a response variable.
The following examples show how to interpret residual variance in each of these methods.
Residual Variance in ANOVA Models
Whenever we fit an ANOVA (“analysis of variance”) model, we end up with an ANOVA table that looks like the following:
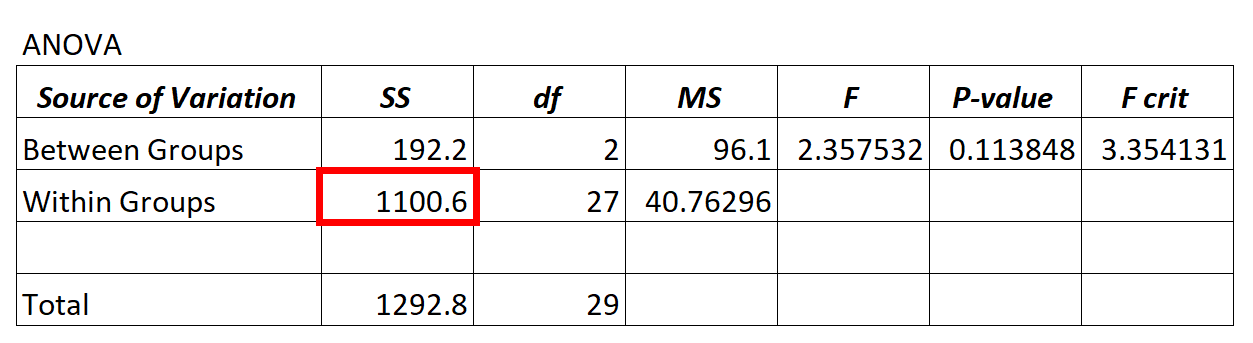
The value for the residual variance of the ANOVA model can be found in the SS (“sum of squares”) column for the Within Groups variation.
This value is also referred to as “sum of squared errors” and is calculated using the following formula:
Σ(Xij – Xj)2
where:
- Σ: a greek symbol that means “sum”
- Xij: the ith observation in group j
- Xj: the mean of group j
In the ANOVA model above we see that the residual variance is 1,100.6.
To determine if this residual variance is “high” we can calculate the mean sum of squared for within groups and mean sum of squared for between groups and find the ratio between the two, which results in the overall F-value in the ANOVA table.
- F = MSbetween / MSwithin
- F = 96.1 / 40.76296
- F = 2.357
The F-value in the ANOVA table above is 2.357 and the corresponding p-value is 0.113848. Since this p-value is not less than α = .05, we do not have sufficient evidence to reject the null hypothesis.
This means we don’t have sufficient evidence to say that the mean difference between the groups we’re comparing is significantly different.
This tells us that the residual variance in the ANOVA model is high relative to the variation that the model actually can explain.
Residual Variance in Regression Models
In a regression model, the residual variance is defined as the sum of squared differences between predicted data points and observed data points.
It is calculated as:
Σ(ŷi – yi)2
where:
- Σ: a greek symbol that means “sum”
- ŷi: The predicted data points
- yi: The observed data points
When we fit a regression model, we typically end up with output that looks like the following:
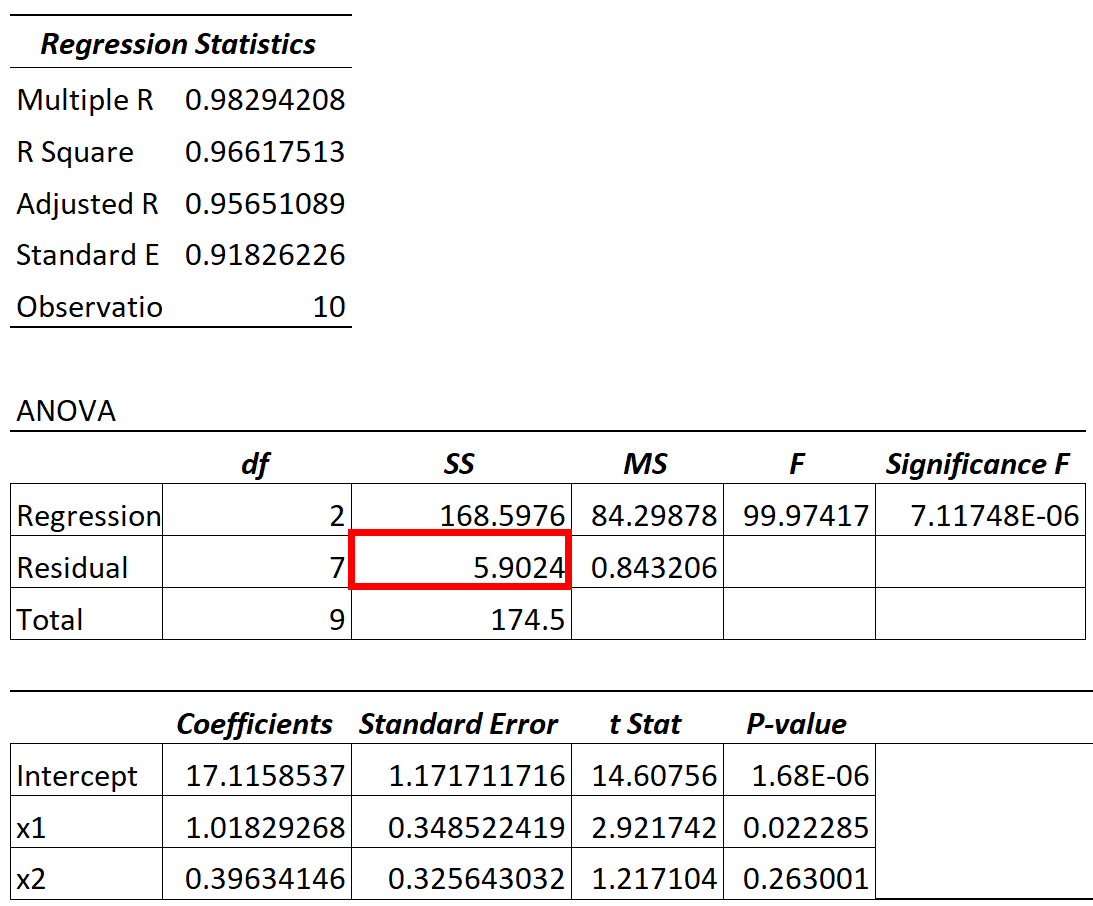
The value for the residual variance of the ANOVA model can be found in the SS (“sum of squares”) column for the Residual variation.
The ratio of the residual variation relative to the total variation in the model tells us the percentage of variation in the response variable that can’t be explained by the predictor variables in the model.
For example, in the table above we would calculate this percentage as:
- Unexplained variation = SS Residual / SS Total
- Unexplained variation = 5.9024 / 174.5
- Unexplained variation = .0338
We can also calculate this value using the following formula:
- Unexplained variation = 1 – R2
- Unexplained variation = 1 – 0.96617
- Unexplained variation = .0338
The R-squared value for the model tells us the percentage of variation in the response variable that can be explained by the predictor variable.
Thus, the lower the unexplained variation, the better a model is able to use the predictor variables to explain the variation in the response variable.
Additional Resources
What is a Good R-squared Value?
How to Calculate R-Squared in Excel
How to Calculate R-Squared in R