A one sample z-test is used to test whether a population mean is significantly different than some hypothesized value.
A two sample z-test is used to test whether two population means are significantly different from each other.
The following examples show how to perform each type of test in Excel.
Example 1: One Sample Z-Test in Excel
Suppose the IQ in a population is normally distributed with a mean of μ = 100 and standard deviation of σ = 15.
A scientist wants to know if a new medication affects IQ levels, so she recruits 20 patients to use it for one month and records their IQ levels at the end of the month.
We can use the following formula in Excel to perform a one sample z-test to determine if the new medication causes a significant difference in IQ levels:
=Z.TEST(A2:A21, 100, 15)
The following screenshot shows how to use this formula in practice:
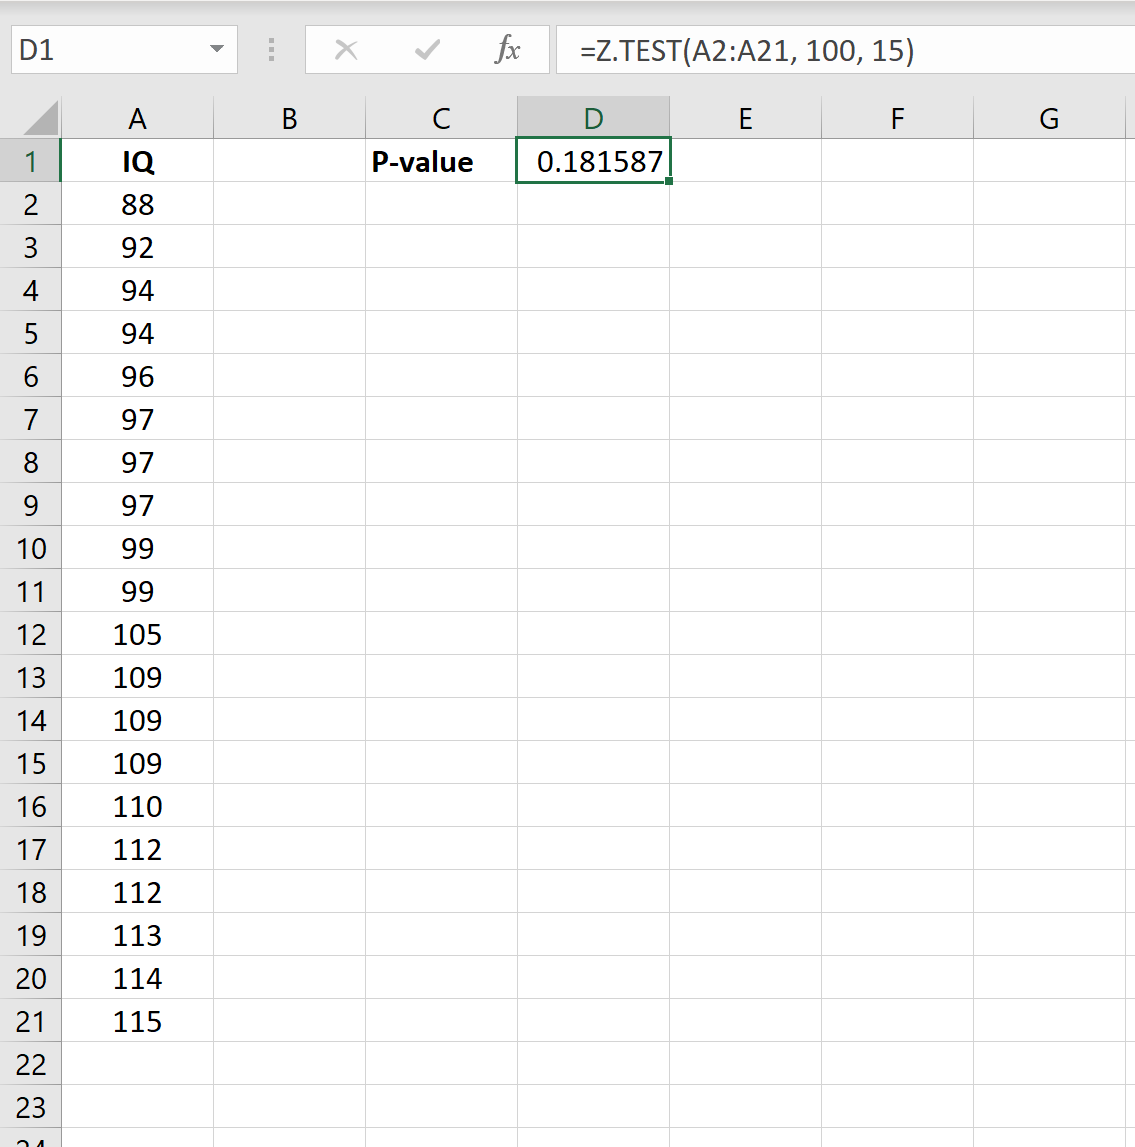
The one-tailed p-value is 0.181587. Since we’re performing a two-tailed test, we can multiply this value by 2 to get p = 0.363174.
Since this p-value is not less than .05, we do not have sufficient evidence to reject the null hypothesis.
Thus, we conclude that the new medication does not significantly affect IQ level.
Example 2: Two Sample Z-Test in Excel
Suppose the IQ levels among individuals in two different cities are known to be normally distributed each with population standard deviations of 15.
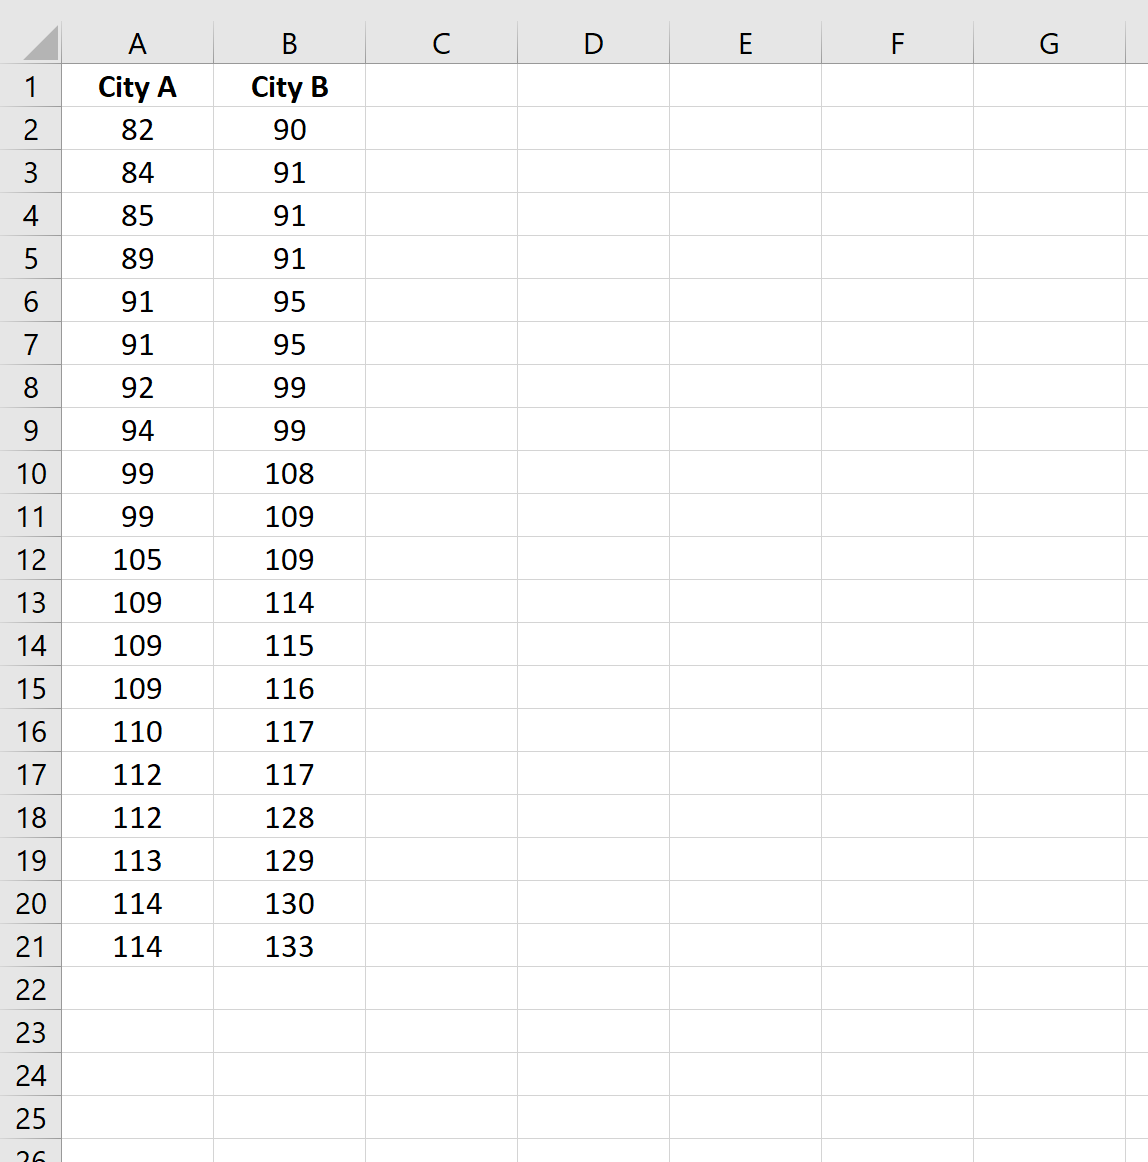
A scientist wants to know if the mean IQ level between individuals in city A and city B are different, so she selects a simple random sample of 20 individuals from each city and records their IQ levels.
The following screenshot shows the IQ levels for the individuals in each sample:
To perform a two sample z-test to determine if the mean IQ level is different between the two cities, click the Data tab along the top ribbon, then click the Data Analysis button within the Analysis group.
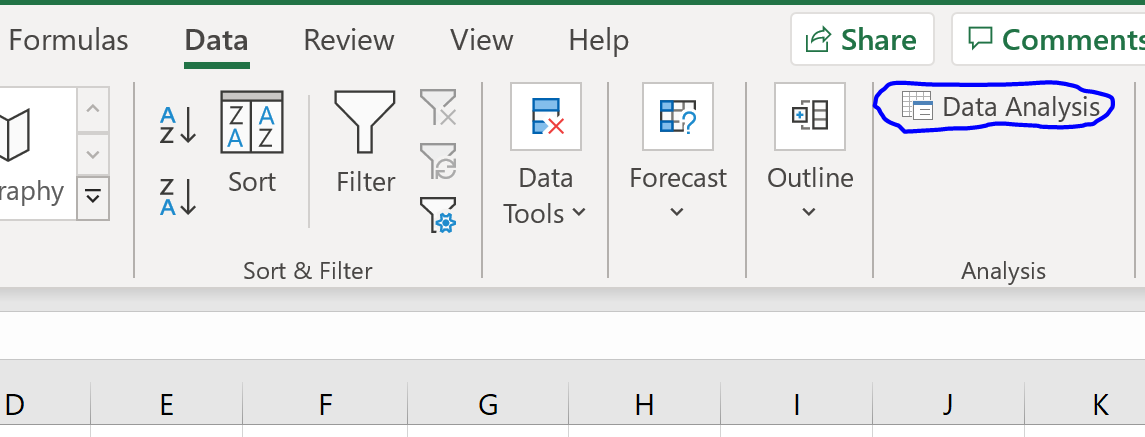
If you don’t see Data Analysis as an option, you need to first load the Analysis ToolPak in Excel.
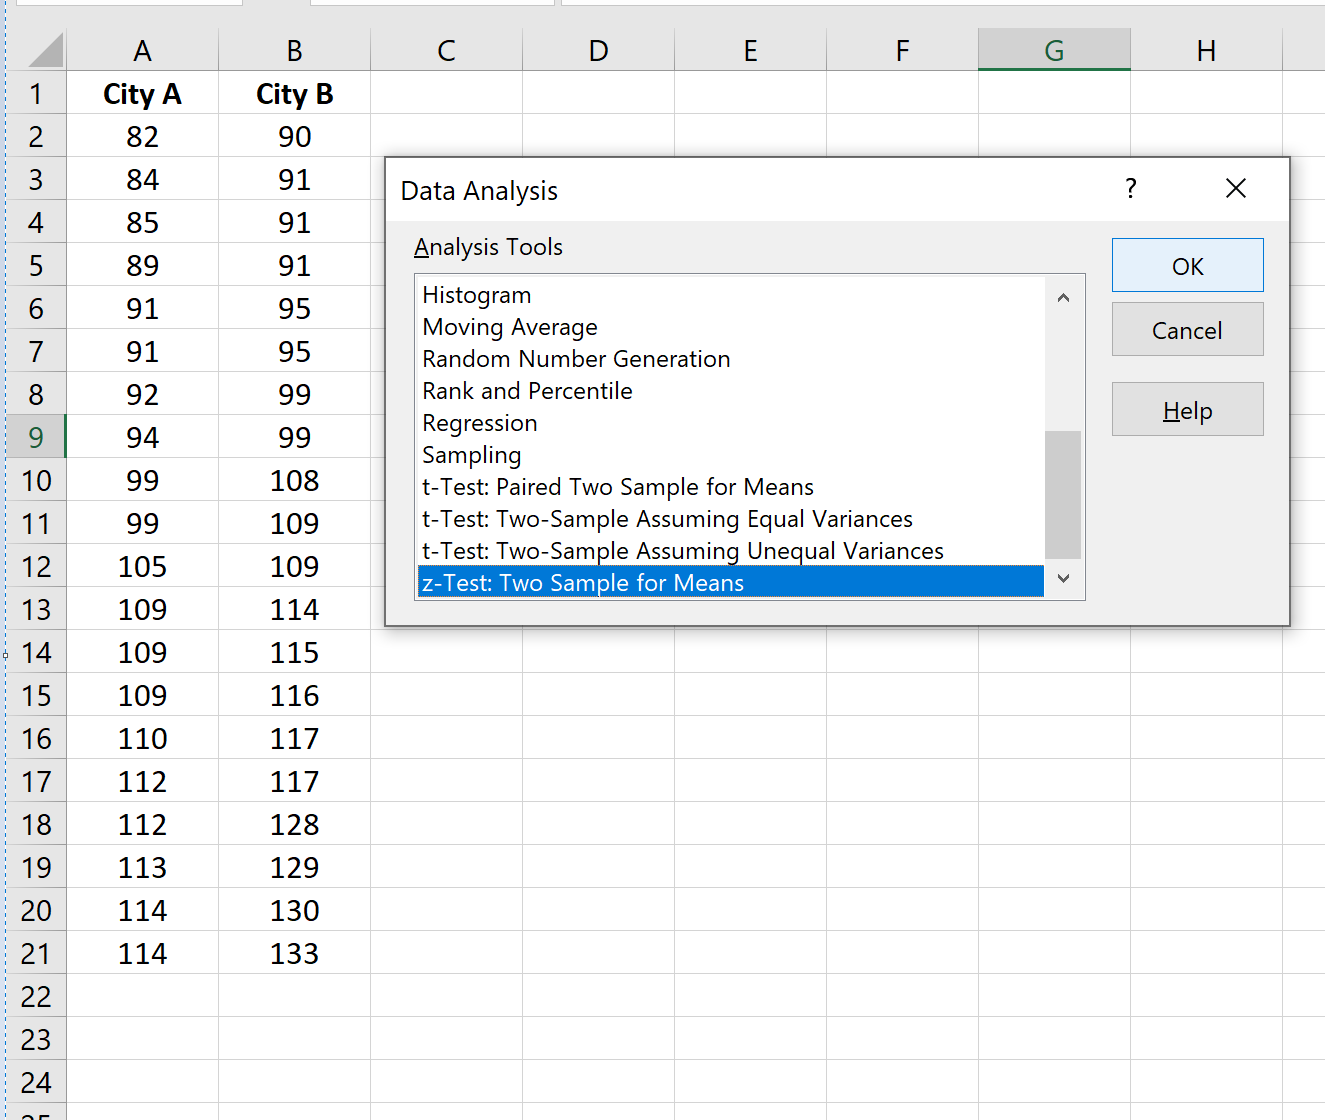
Once you click this button, select z-Test: Two Sample for Means in the new window that appears:
Once you click OK, you can fill in the following information:
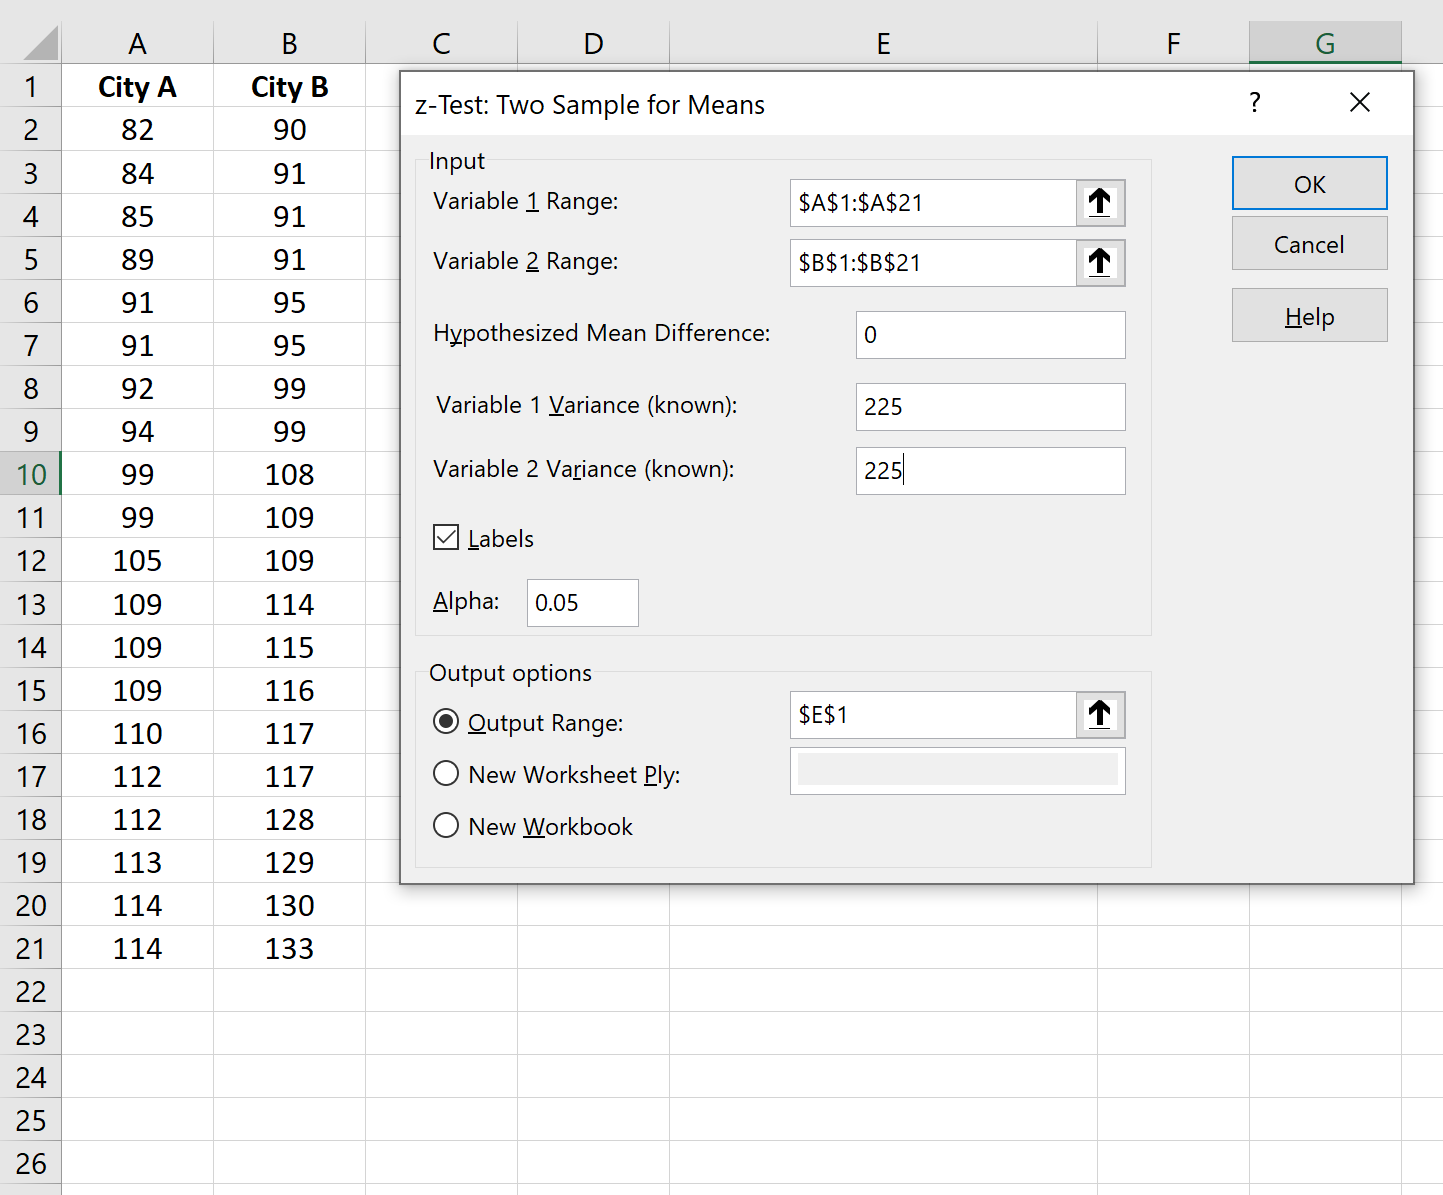
Once you click OK, the results will appear in cell E1:
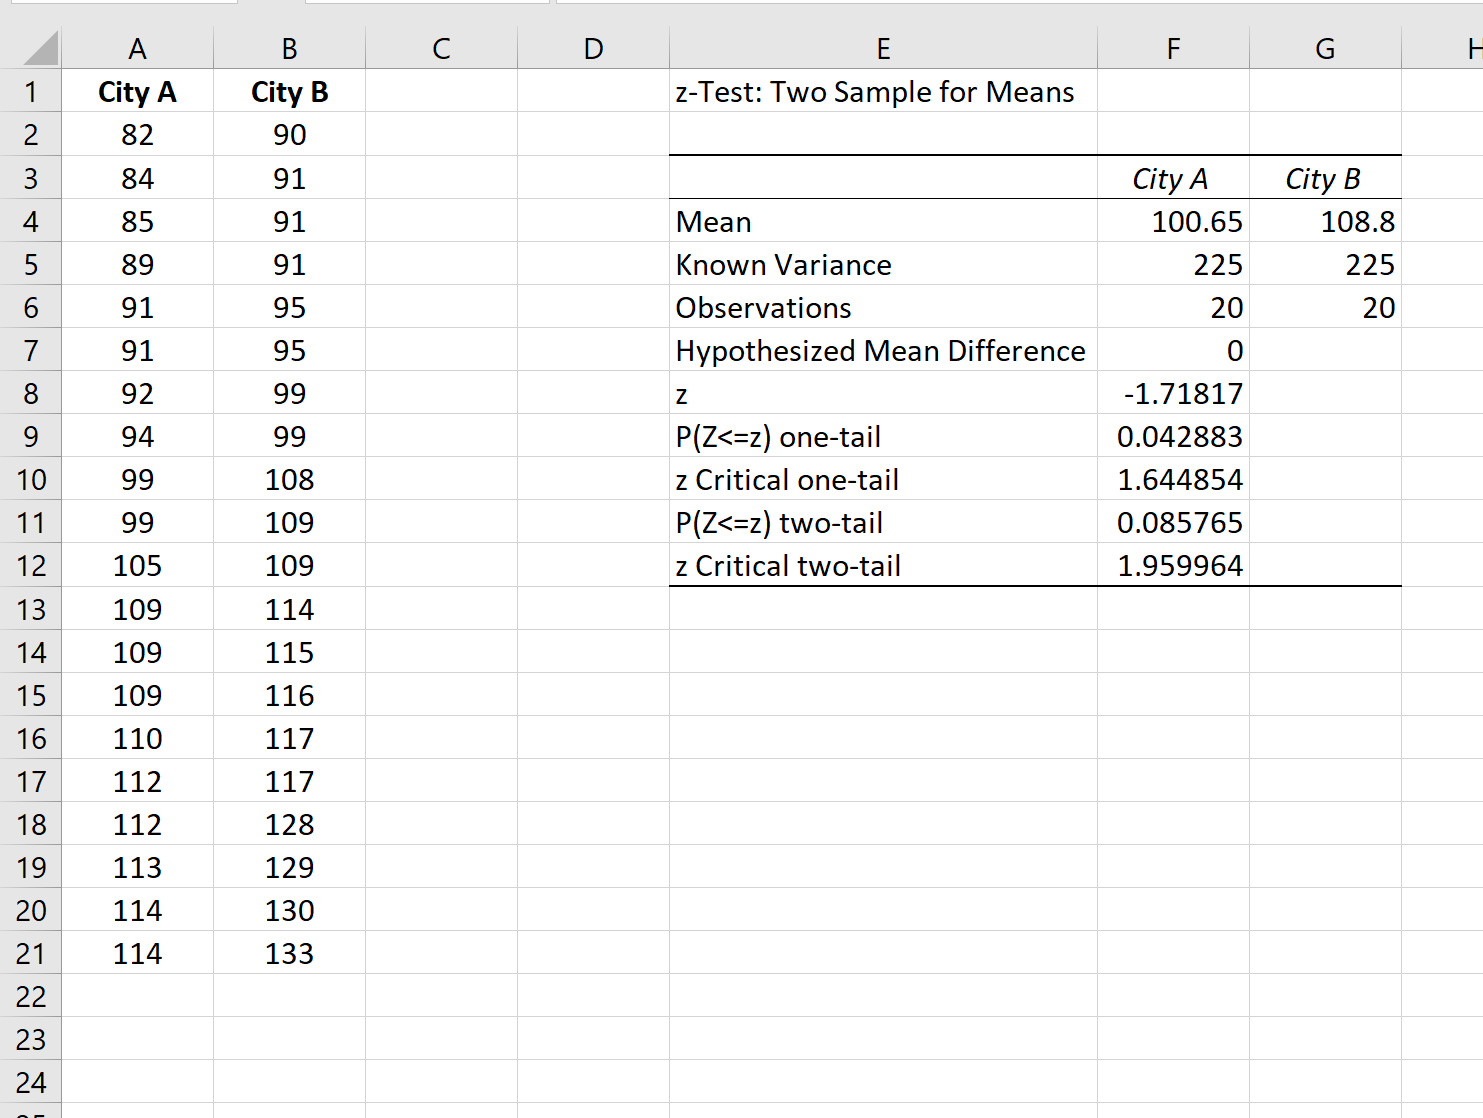
The test statistic for the two sample z-test is -1.71817and the corresponding p-value is .085765.
Since this p-value is not less than .05, we do not have sufficient evidence to reject the null hypothesis.
Thus, we conclude that the mean IQ level is not significantly different between the two cities.
Additional Resources
The following tutorials explain how to perform other common statistical tests in Excel:
How to Conduct a One Sample t-Test in Excel
How to Conduct a Two Sample t-Test in Excel
How to Conduct a Paired Samples t-Test in Excel
How to Perform Welch’s t-Test in Excel