A paired samples t-test is used to compare the means of two samples when each observation in one sample can be paired with an observation in the other sample.
This tutorial explains how to conduct a paired samples t-test in Excel.
How to Conduct a Paired Samples t-Test in Excel
Suppose we want to know whether a certain study program significantly impacts student performance on a particular exam. To test this, we have 20 students in a class take a pre-test. Then, we have each of the students participate in the study program for two weeks. Then, the students retake a test of similar difficulty.
To compare the difference between the mean scores on the first and second test, we use a paired samples t-test because for each student their first test score can be paired with their second test score.
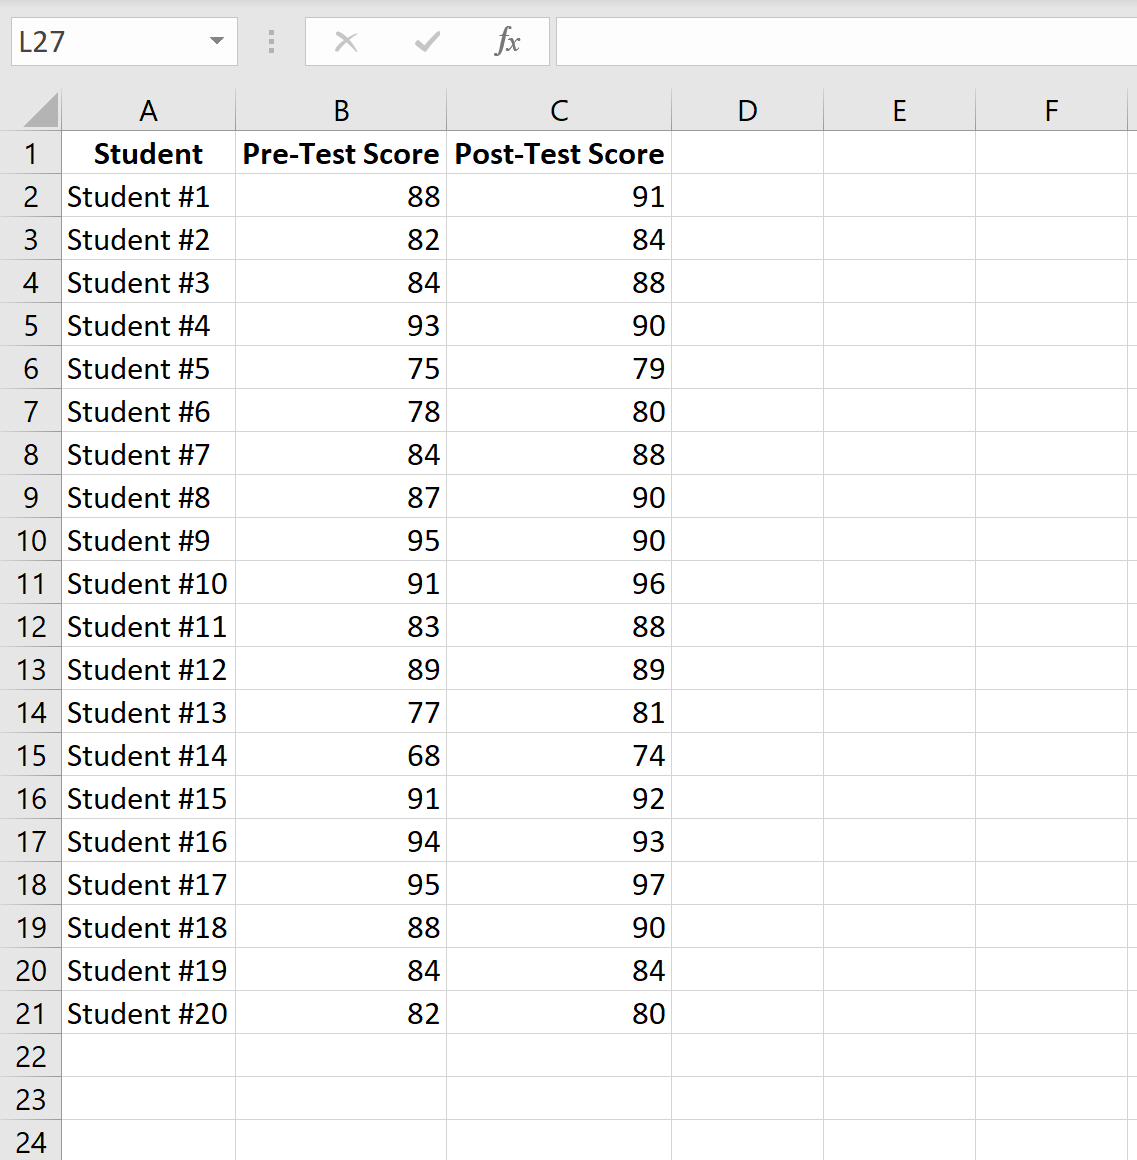
The following image shows the pre-test score and post-test score for each student:
Perform the following steps to conduct a paired samples t-test to determine if there is a significant difference in the mean test scores between the pre-test and post-test.
Step 1: Open the Data Analysis ToolPak.
On the Data tab along the top ribbon, click “Data Analysis.”
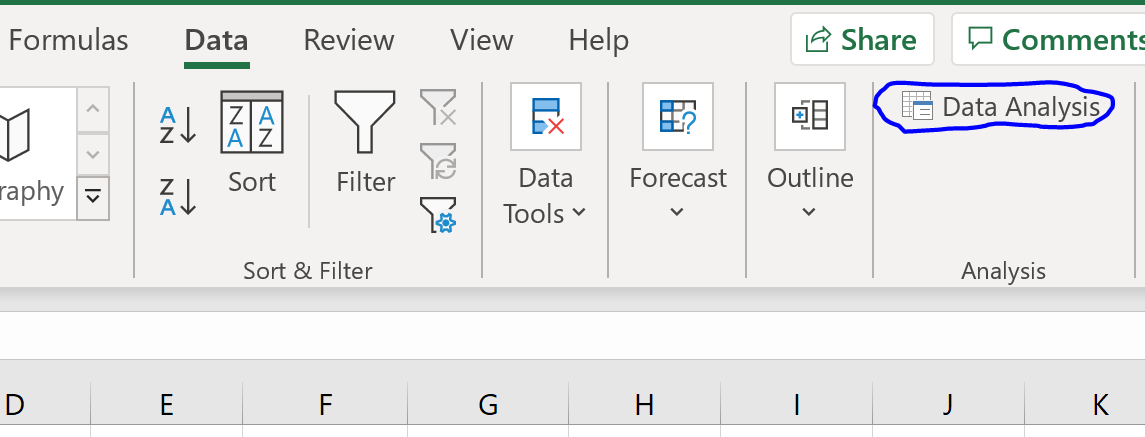
If you don’t see this as an option to click on, you need to first download the Analysis ToolPak, which is completely free.
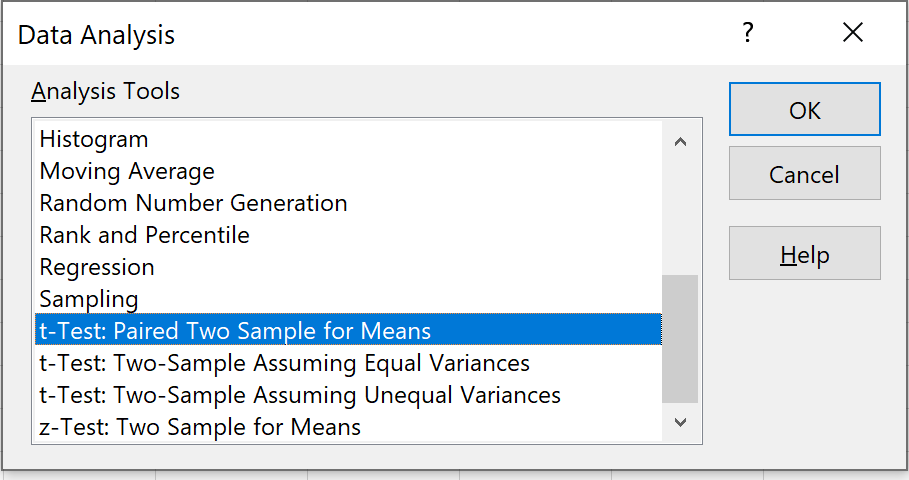
Step 2: Select the appropriate test to use.
Select the option that says t-Test: Paired Two Sample for Means and then click OK.
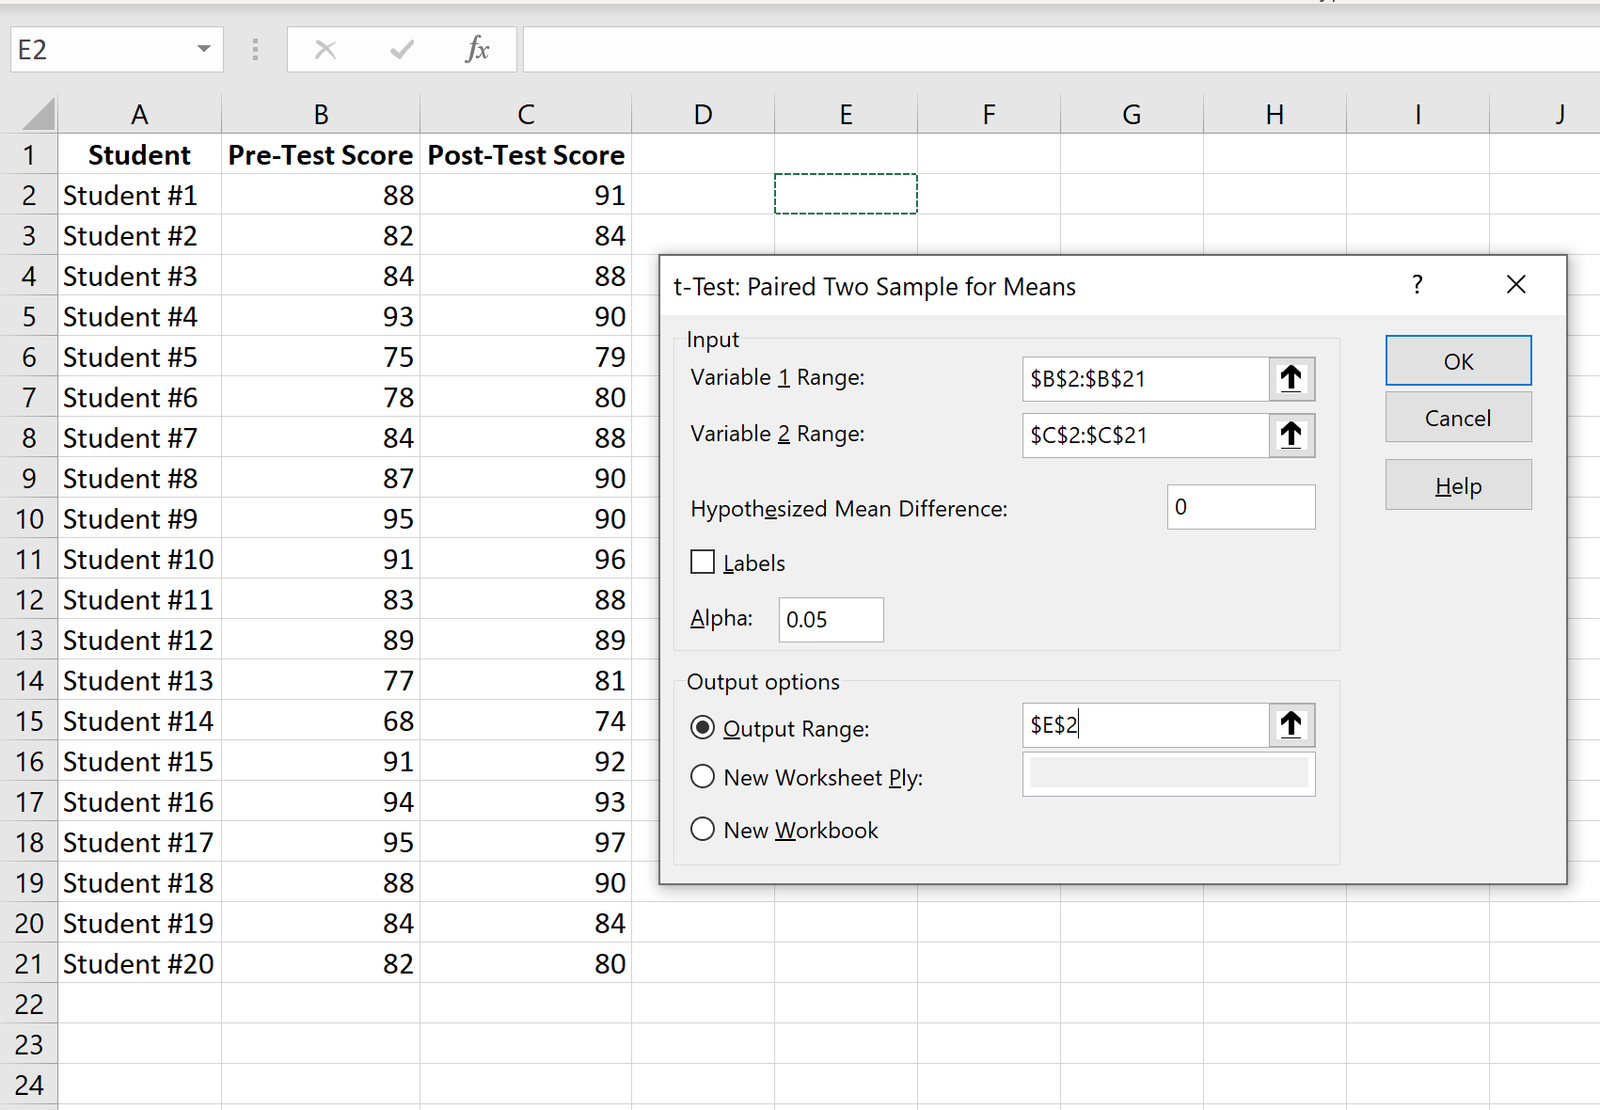
Step 3: Enter the necessary info.
Enter the range of values for Variable 1 (the pre-test scores), Variable 2 (the post-test scores), the hypothesized mean difference (in this case we put “0” because we want to know if the true mean difference between pre-test scores and post-test scores is 0), and the output range where we would like to see the results of the test displayed. Then, click OK.
Step 4: Interpret the results.
Once you click OK in the previous step, the results of the t-test will be displayed.
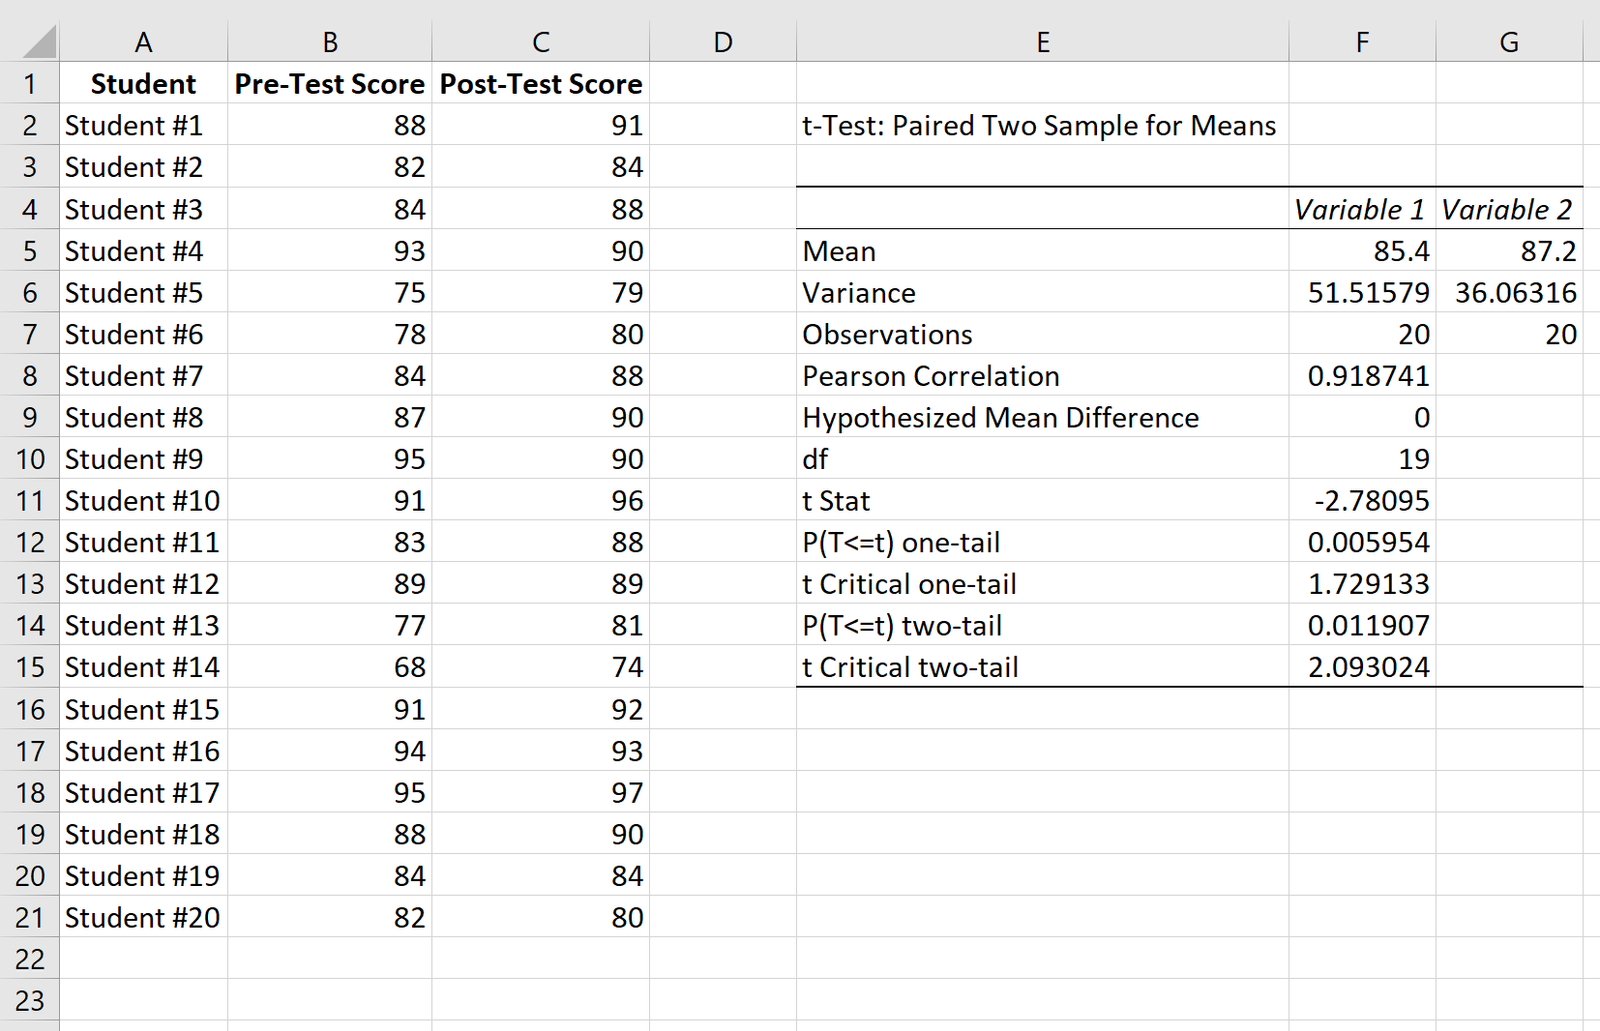
Here is how to interpret the results:
Mean: This is the mean for each sample. The mean pre-test score is 85.4 and the mean post-test score is 87.2.
Variance: This is the variance for each sample. The variance of the pre-test scores is 51.51 and the variance for the post-test scores is 36.06.
Observations: This is the number of observations in each sample. Both samples have 20 observations.
Pearson Correlation: The correlation between the pre-test scores and post-test scores. It turns out to be 0.918.
Hypothesized mean difference: The number that we “hypothesize” is the difference between the two means. In this case, we chose 0 because we want to test whether or not there is any difference at all between pre-test and post-test scores.
df: The degrees of freedom for the t-test. This is calculated as n-1 where n is the number of pairs. In this case, df = 20 – 1 = 19.
t Stat: The test statistic t, which turns out to be -2.78.
P(TThe p-value for a two-tailed t-test. In this case, p = 0.011907. This is smaller than alpha = 0.05, so we reject the null hypothesis. We have sufficient evidence to say that there is a statistically significant difference between the mean pre-test and post-test score.
t Critical two-tail: This is the critical value of the test, found by identifying the value in the t Distribution table that corresponds with a two-tailed test with alpha = 0.05 and df = 19. This turns out to be 2.093024. Since the absolute value of our test statistic t is greater than this value, we reject the null hypothesis. We have sufficient evidence to say that there is a statistically significant difference between the mean pre-test and post-test score.
Note that the p-value and the critical value approach will both lead to the same conclusion.
Additional Resources
The following tutorials explain how to perform other t-tests in Excel:
How to Conduct a One Sample t-Test in Excel
How to Conduct a Two Sample t-Test in Excel