A two sample t-test is used to test whether or not the means of two populations are equal.
This tutorial explains how to conduct a two sample t-test in Excel.
How to Conduct a Two Sample t-Test in Excel
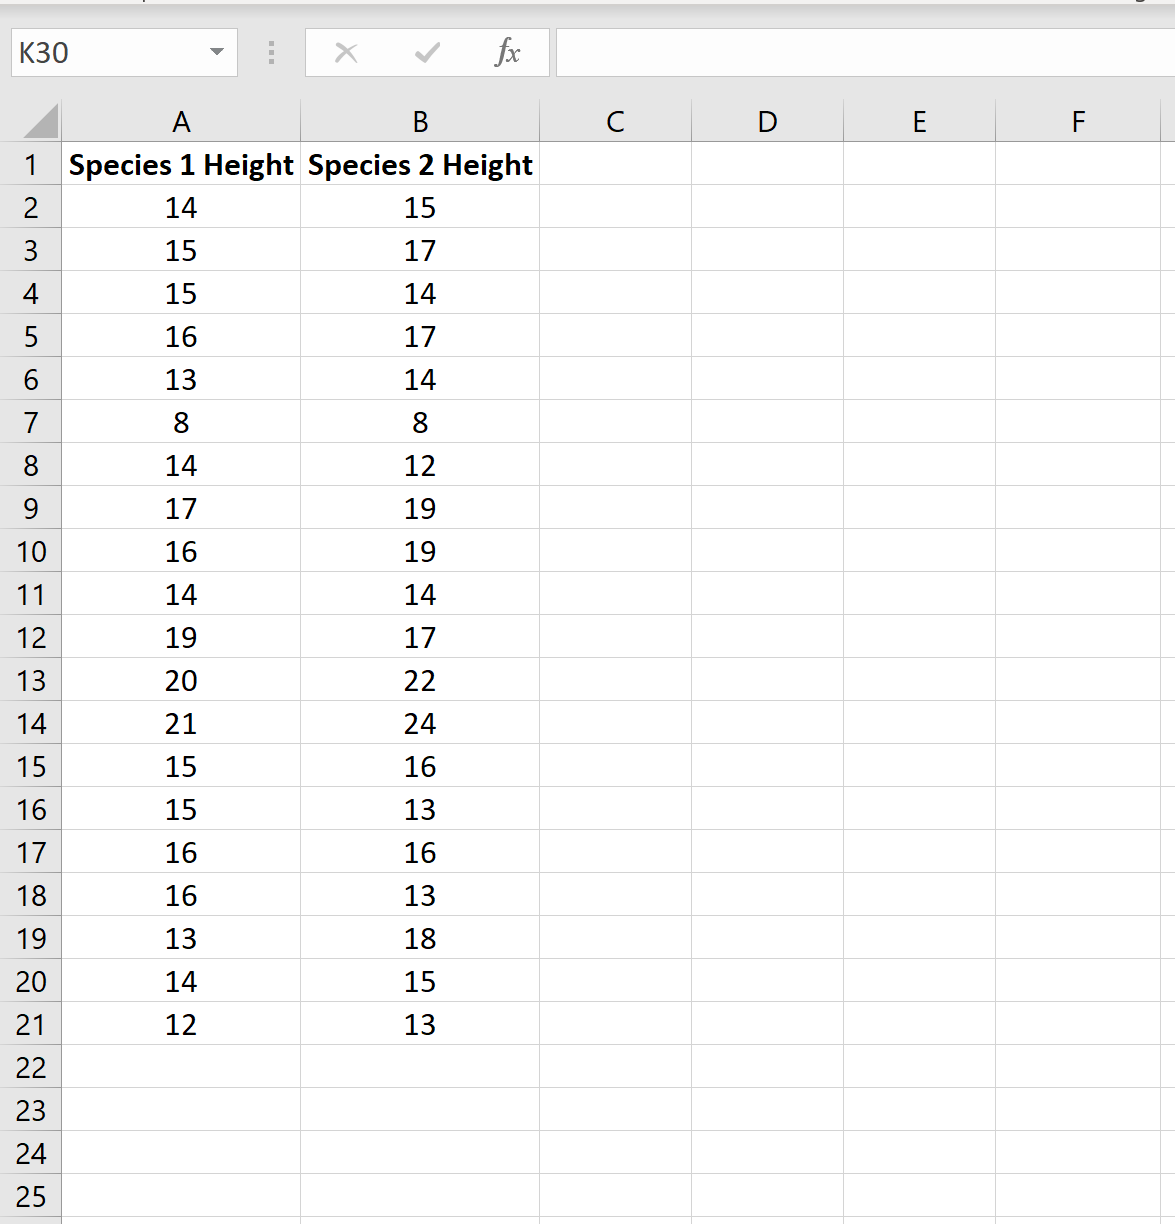
Suppose researchers want to know whether or not two different species of plants in a particular country have the same mean height. Because it would take too long to go around and measure every single plant, they decide to collect a sample of 20 plants from each species.
The following image shows the height (in inches) for each plant in each sample:
We can conduct a two sample t-test to determine if the two species have the same mean height using the following steps:
Step 1: Determine if the population variances are equal.
When we conduct a two sample t-test, we must first decide if we will assume that the two populations have equal or unequal variances. As a rule of thumb, we can assume the populations have equal variances if the ratio of the larger sample variance to the smaller sample variance is less than 4:1.
We can find the variance for each sample using the Excel function =VAR.S(Cell range), as the following image shows:
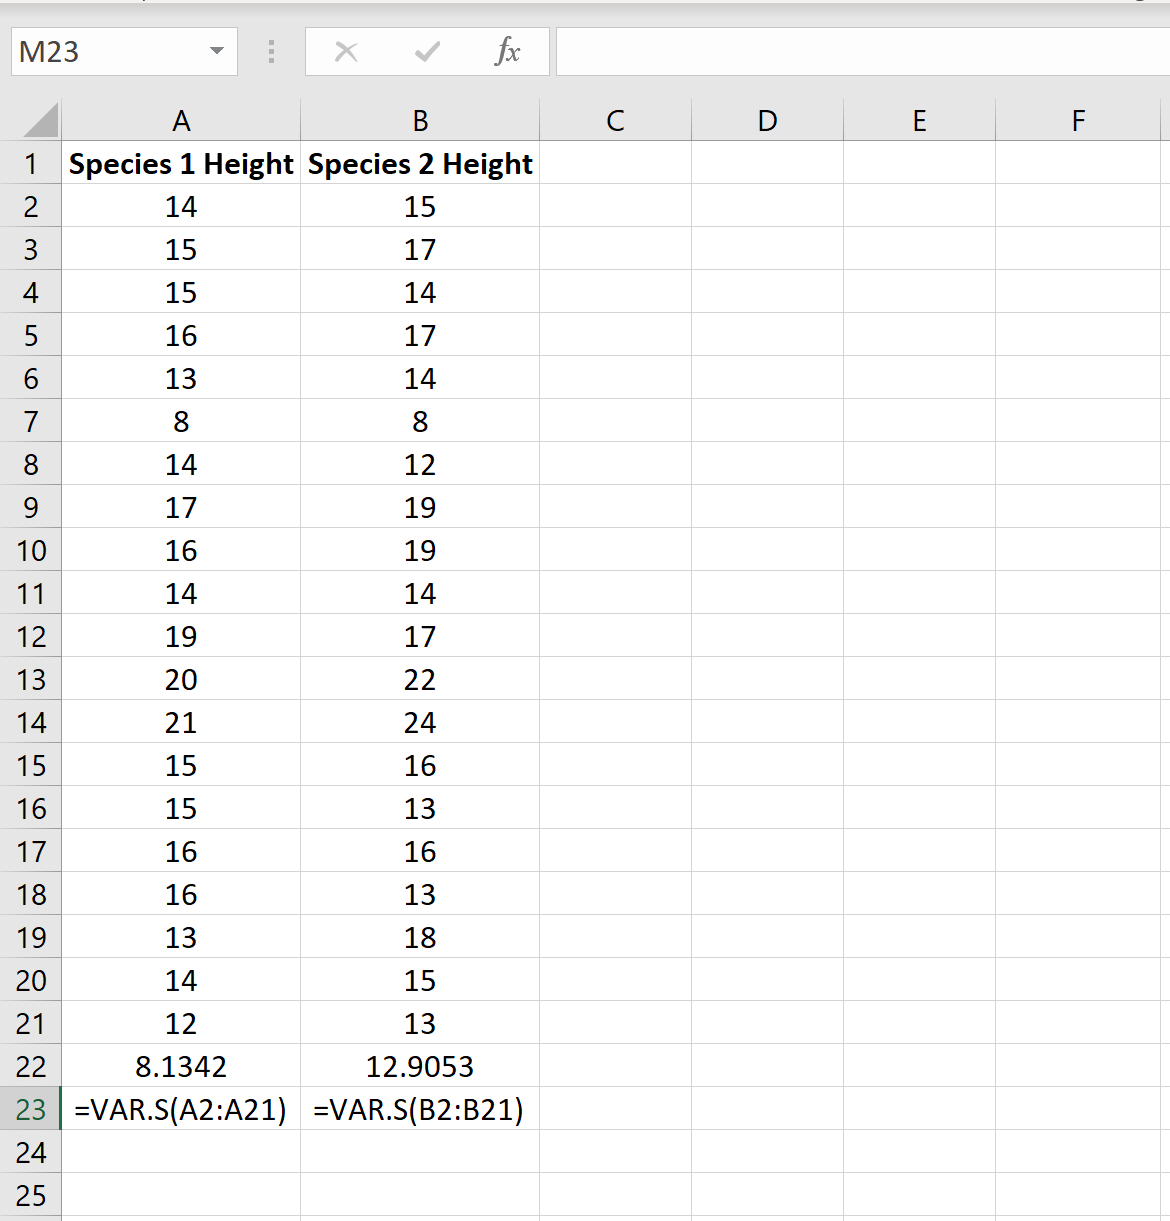
The ratio of the larger sample variance to the smaller sample variance is 12.9053 / 8.1342 = 1.586, which is less than 4. This means we can assume that the population variances are equal.
Step 2: Open the Analysis ToolPak.
On the Data tab along the top ribbon, click “Data Analysis.”
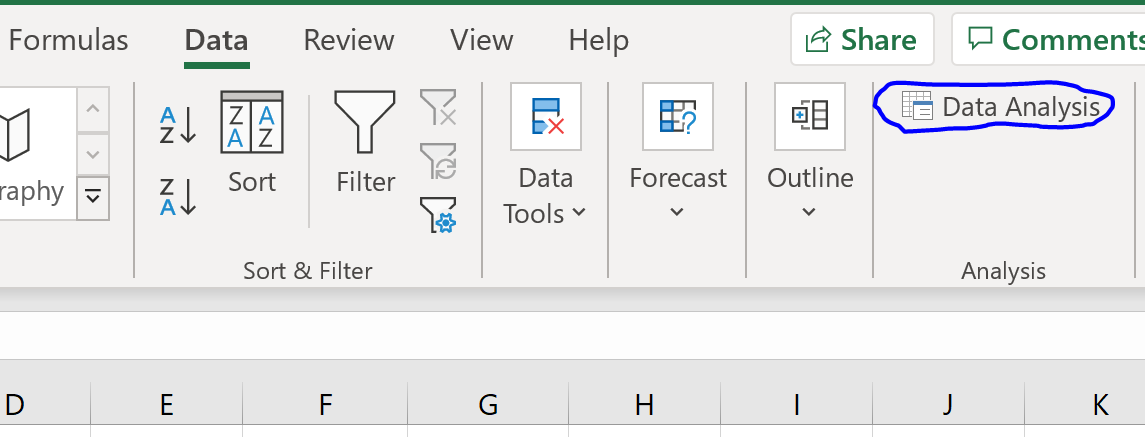
If you don’t see this as an option to click on, you need to first download the Analysis ToolPak, which is completely free.
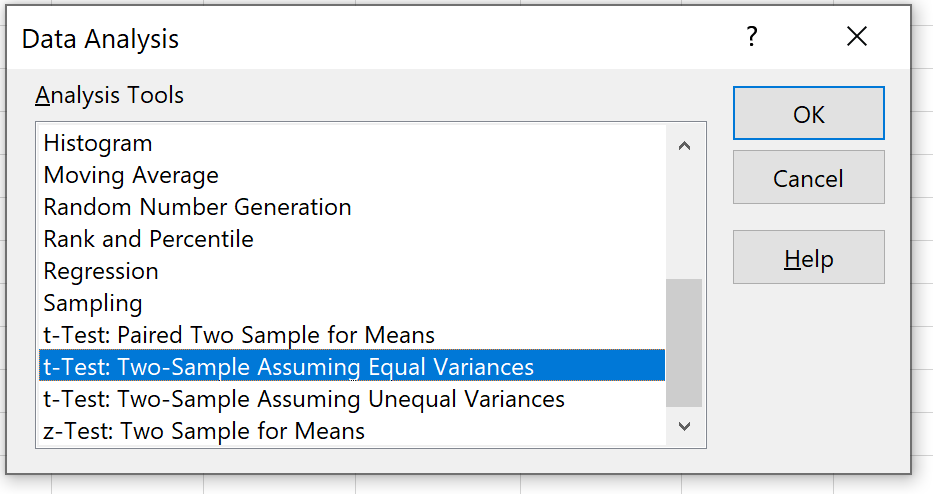
Step 3: Select the appropriate test to use.
Select the option that says t-Test: Two-Sample Assuming Equal Variances and then click OK.
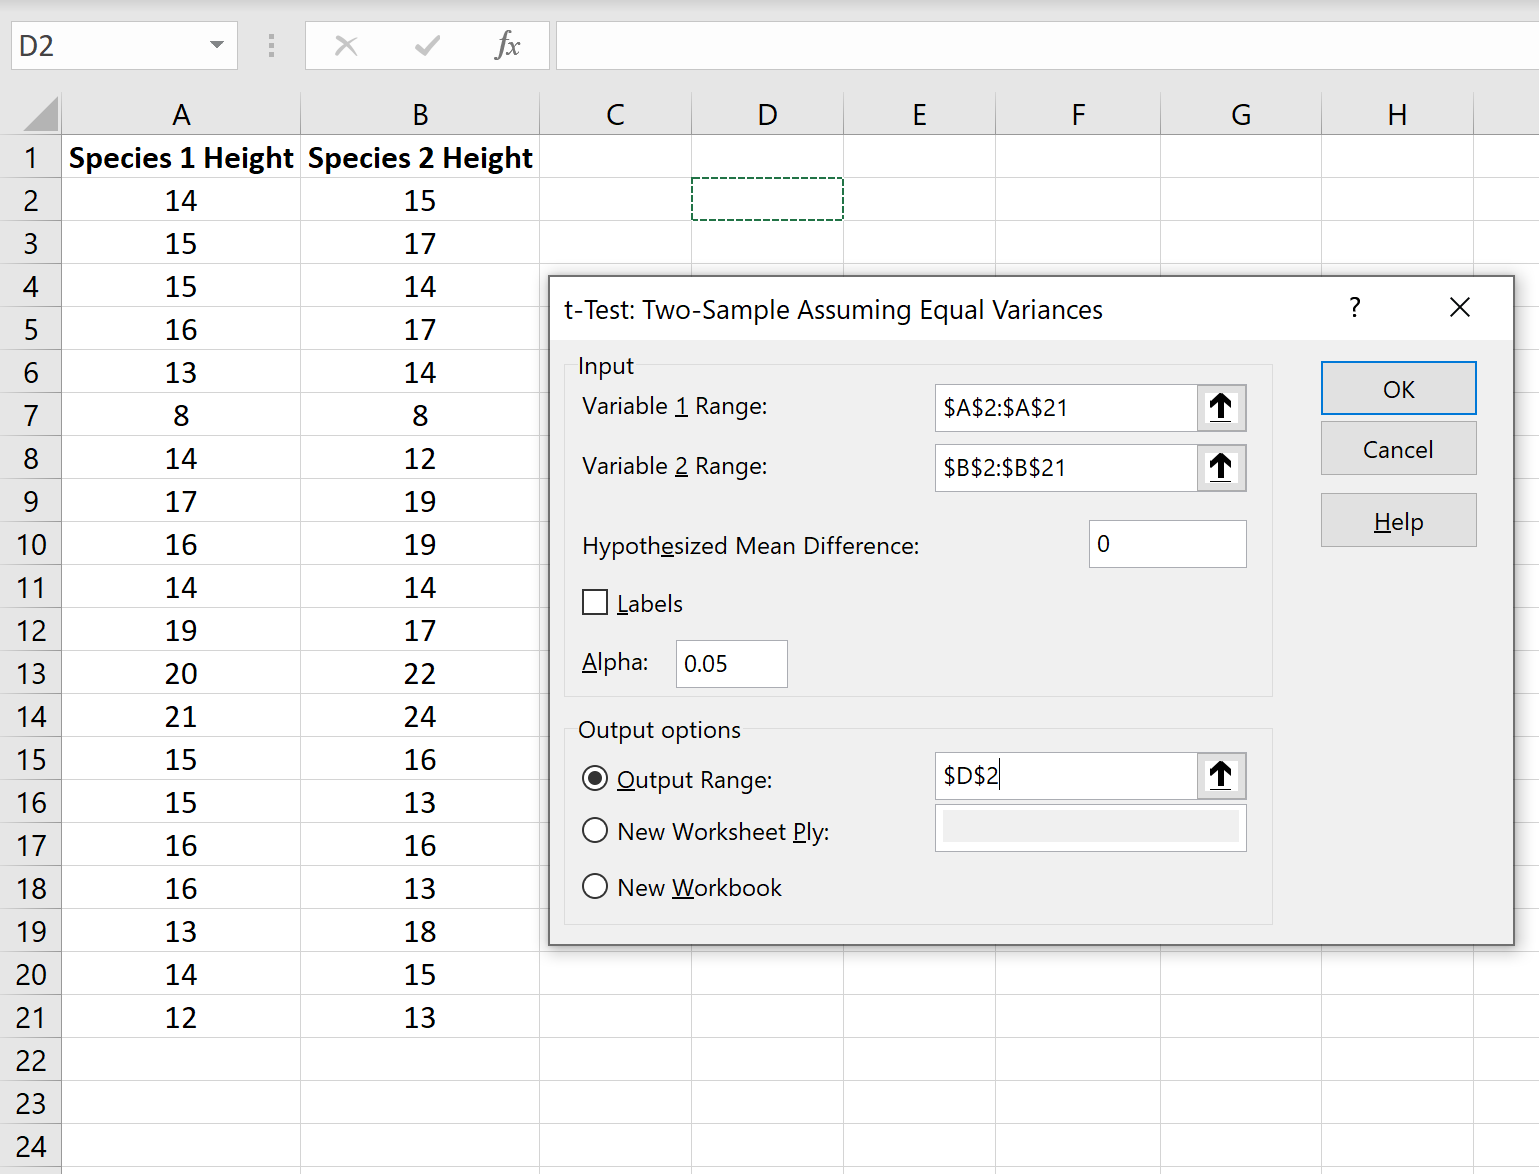
Step 4: Enter the necessary info.
Enter the range of values for Variable 1 (our first sample), Variable 2 (our second sample), the hypothesized mean difference (in this case we put “0” because we want to know if the true mean population difference is 0), and the output range where we would like to see the results of the t-test displayed. Then, click OK.
Step 5: Interpret the results.
Once you click OK in the previous step, the results of the t-test will be displayed.
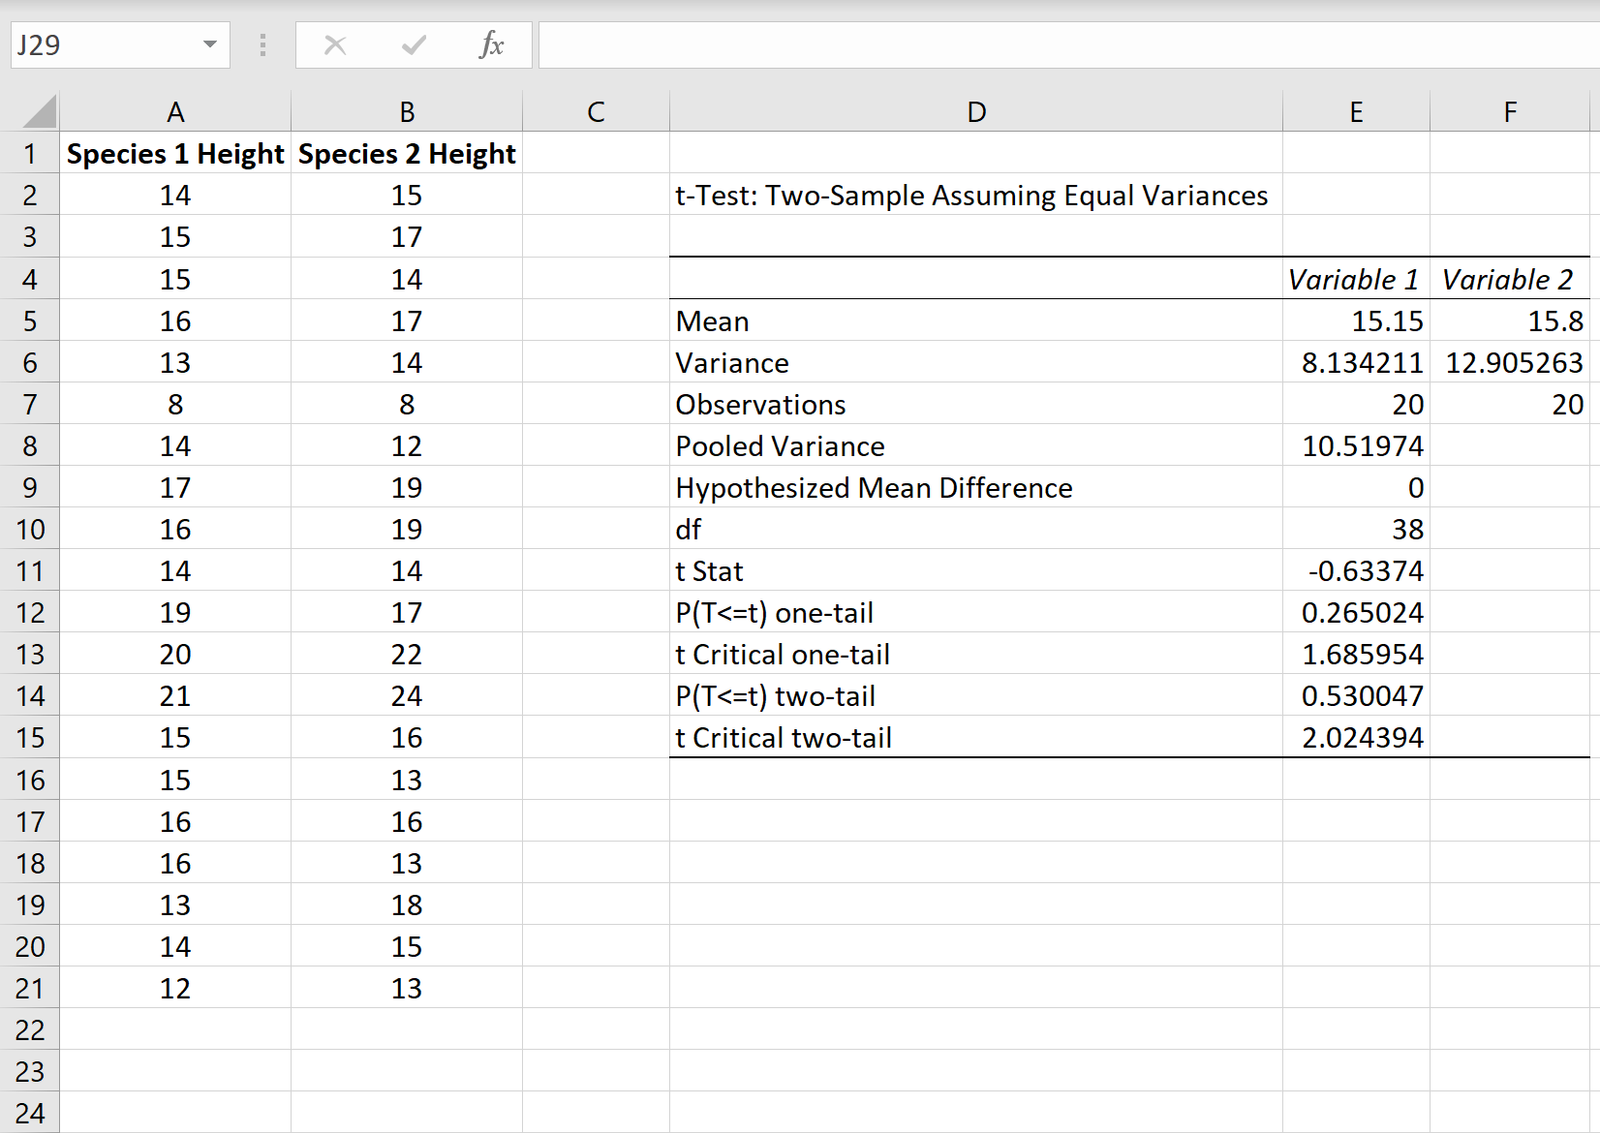
Here is how to interpret the results:
Mean: This is the mean for each sample. Sample 1 has a mean height of 15.15 and sample 2 has a mean height of 15.8.
Variance: This is the variance for each sample. Sample 1 has a variance of 8.13 and sample 2 has a variance of 12.90.
Observations: This is the number of observations in each sample. Both samples have 20 observations (e.g. 20 individual plants in each sample).
Pooled Variance: A number that is calculated by “pooling” the variances of each sample together using the formula s2p = [ (n1-1)s21 + (n2-1)s22 ] / (n1+n2-2), which turns out to be 10.51974. This number is later used when calculating the test statistic t.
Hypothesized mean difference: The number that we “hypothesize” is the difference between the two population means. In this case, we chose 0 because we want to test whether or not the difference between the two populations means is 0, e.g. there is no difference.
df: The degrees of freedom for the t-test, calculated as n1 + n2 -2 = 20 + 20 – 2 = 38.
t Stat: The test statistic t, calculated as t = [ x1 – x2 ] / √ [ s2p(1/n1 + 1/n2) ]
In this case, t = [15.15-15.8] / √ [ 10.51974(1/20+1/20) ] = -0.63374.
P(TThe p-value for a two-tailed t-test. In this case, p = 0.530047. This is much larger than alpha = 0.05, so we fail to reject the null hypothesis. We do not have sufficient evidence to say that the two population means are different.
t Critical two-tail: This is the critical value of the test, found by identifying the value in the t Distribution table that corresponds with a two-tailed test with alpha = 0.05 and df = 38. This turns out to be 2.024394. Since our test statistic t is less than this value, we fail to reject the null hypothesis. We do not have sufficient evidence to say that the two population means are different.
Note that the p-value and the critical value approach will both lead to the same conclusion.
Additional Resources
The following tutorials explain how to perform other types of t-tests in Excel:
How to Conduct a One Sample t-Test in Excel
How to Conduct a Paired Samples t-Test in Excel