Multiple linear regression is a method we can use to understand the relationship between several explanatory variables and a response variable.
Unfortunately, one problem that often occurs in regression is known as heteroscedasticity, in which there is a systematic change in the variance of residuals over a range of measured values.
One test that we can use to determine if heteroscedasticity is present is the Breusch-Pagan Test. This test produces a Chi-Square test statistic and a corresponding p-value.
If the p-value is below a certain threshold (common choices are 0.01, 0.05, and 0.10) then there is sufficient evidence to say that heteroscedasticity is present.
This tutorial explains how to perform a Breusch-Pagan Test in Stata.
Example: Breusch-Pagan Test in Stata
We will use the built-in Stata dataset auto to illustrate how to perform the Breusch-Pagan Test.
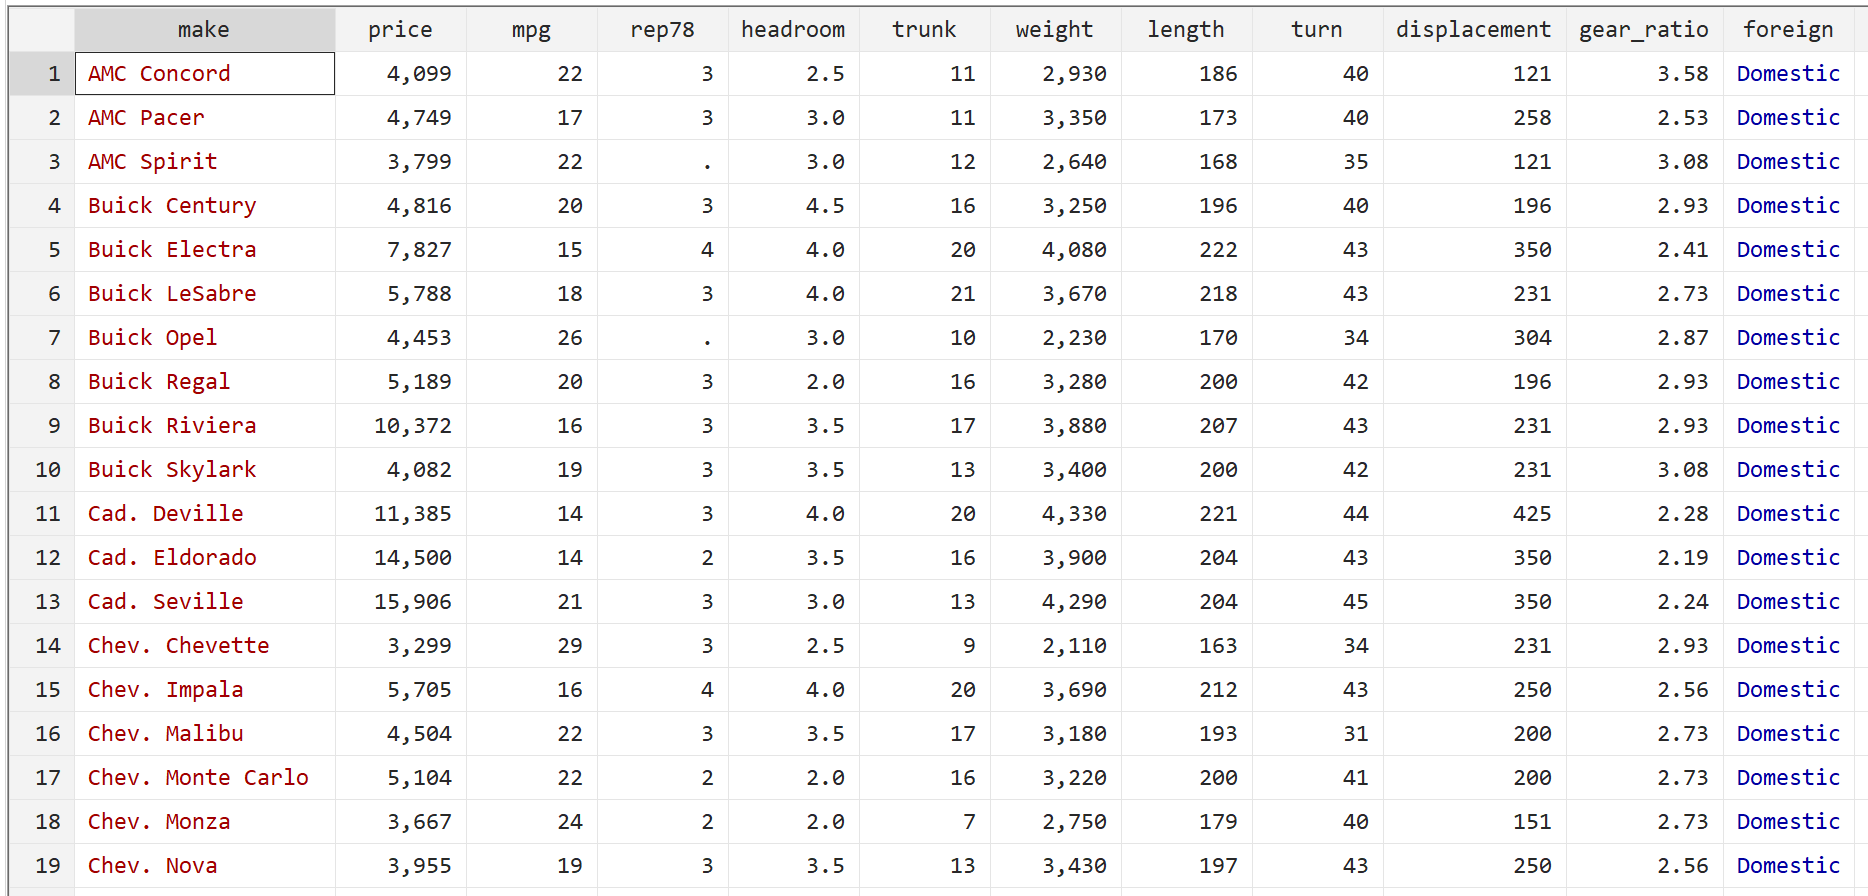
Step 1: Load and view the data.
First, use the following command to load the data:
sysuse auto
Then, view the raw data by using the following command:
br
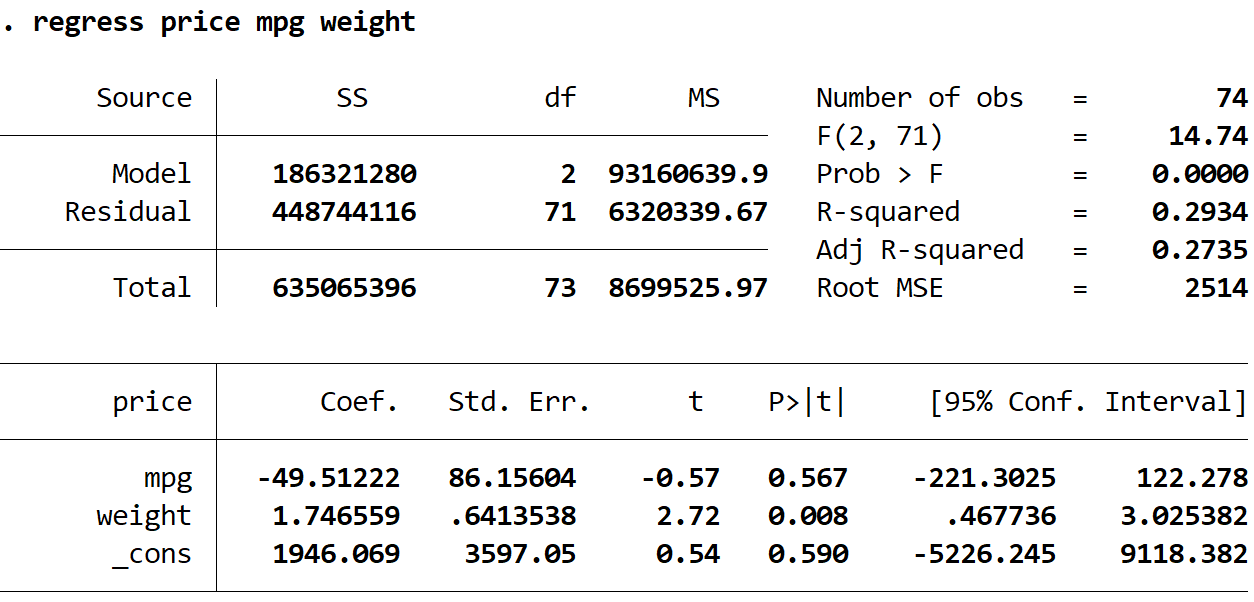
Step 2: Perform multiple linear regression.
Next, we will type in the following command to perform a multiple linear regression using price as the response variable and mpg and weight as the explanatory variables:
regress price mpg weight
Step 3: Perform the Breusch-Pagan Test.
Once we fit the regression model, then we can perform the Breusch-Pagan Test using the hettest command, which is short for “heteroscedasticity test”:
hettest
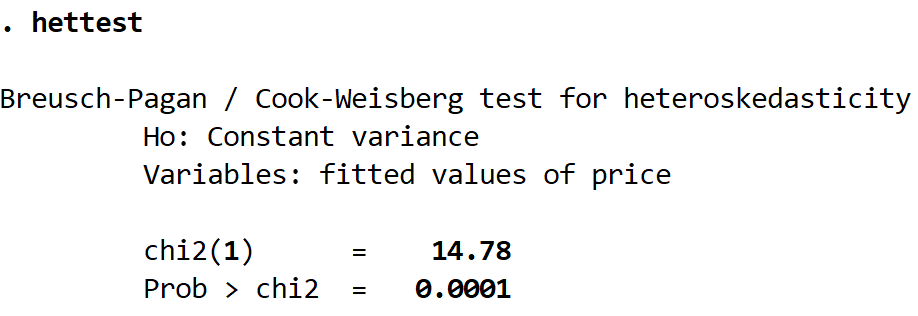
Here is how to interpret the output:
Ho: This is the null hypothesis of the test, which states that there is constant variance among the residuals.
Variables: This tells us the response variable that was used in the regression model. In this case, it was the variable price.
chi2(1): This is the Chi-Square test statistic of the test. In this case, it is 14.78.
Prob > chi2: This is the p-value that corresponds to the Chi-Square test statistic. In this case, it is 0.0001. Since this value is less than 0.05, we can reject the null hypothesis and conclude that heteroscedasticity is present in the data.
What To Do Next
If you fail to reject the null hypothesis of the Breusch-Pagan test, then heteroscedasticity is not present and you can proceed to interpret the output of the original regression.
However, if you reject the null hypothesis of the Breusch-Pagan test, this means heteroscedasticity is present in the data. In this case, the standard errors that are shown in the output table of the regression are unreliable. There are several ways that you can fix this issue, including:
1. Transform the response variable. You can try performing a transformation on the response variable. For example, you could use log(price) instead of price as the response variable. Typically taking the log of the response variable is an effective way of making heteroscedasticity go away. Another common transformation is to use the square root of the response variable.
2. Use weighted regression. This type of regression assigns a weight to each data point based on the variance of its fitted value. Essentially, this gives small weights to data points that have higher variances, which shrinks their squared residuals. When the proper weights are used, this can eliminate the problem of heteroscedasticity.
3. Use robust standard errors. Robust standard errors are more “robust” to the problem of heteroscedasticity and tend to provide a more accurate measure of the true standard error of a regression coefficient. Check out this tutorial to learn about how to use robust standard errors in regression in Stata.