A one proportion z-test is used to compare an observed proportion to a theoretical one.
For example, suppose a phone company claims that 90% of its customers are satisfied with their service. To test this claim, an independent researcher gathered a simple random sample of 200 customers and asked them if they are satisfied with their service, to which 85% responded yes.
We can use a one proportion z-test to test whether or not the true percentage of customers who are satisfied with their service is actually 90%.
Steps to Perform a One Sample Z-Test
We can use the following steps to perform the one proportion z-test:
Step 1. State the hypotheses.
The null hypothesis (H0): P = 0.90
The alternative hypothesis: (Ha): P ≠ 0.90
Step 2. Find the test statistic and the corresponding p-value.
Test statistic z = (p-P) / (√P(1-P) / n)
where p is the sample proportion, P is the hypothesized population proportion, and n is the sample size.
z = (.85-.90) / (√.90(1-.90) / 200) = (-.05) / (.0212) = -2.358
Use the Z Score to P Value Calculator with a z score of -2.358 and a two-tailed test to find that the p-value = 0.018.
Step 3. Reject or fail to reject the null hypothesis.
First, we need to choose a significance level to use for the test. Common choices are 0.01, 0.05, and 0.10. For this example, let’s use 0.05. Since the p-value is less than our significance level of .05, we reject the null hypothesis.
Since we rejected the null hypothesis, we have sufficient evidence to say that it’s not true that 90% of customers are satisfied with their service.
How to Perform a One Sample Z-Test in Excel
The following examples illustrate how to perform a one sample z-test in Excel.
One Sample Z Test (Two-tailed)
A phone company claims that 90% of its customers are satisfied with their service. To test this claim, an independent researcher gathered a simple random sample of 200 customers and asked them if they are satisfied with their service, to which 190 responded yes.
Test the null hypothesis that 90% of customers are satisfied with their service against the alternative hypothesis that not 90% of customers are satisfied with their service. Use a 0.05 level of significance.
The following screenshot shows how to perform a two-tailed one sample z test in Excel, along with the formulas used:
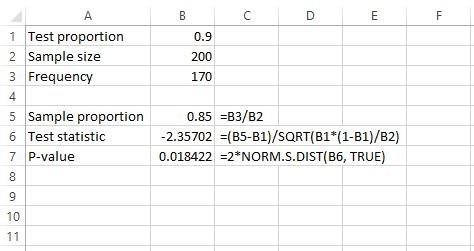
You need to fill in the values for cells B1:B3. Then, the values for cells B5:B7 are automatically calculated using the formulas shown in cells C5:C7.
Note that the formulas shown do the following:
- Formula in cell C5: This calculates the sample proportion using the formula Frequency / Sample size
- Formula in cell C6: This calculates the test statistic using the formula (p-P) / (√P(1-P) / n) where p is the sample proportion, P is the hypothesized population proportion, and n is the sample size.
- Formula in cell C6: This calculates the p-value associated with the test statistic calculated in cell B6 using the Excel function NORM.S.DIST, which returns the cumulative probability for the normal distribution with mean = 0 and standard deviation = 1. We multiply this value by two since this is a two-tailed test.
Since the p-value (0.018) is less than our chosen significance level of 0.05, we reject the null hypothesis and conclude that the true percentage of customers who are satisfied with their service is not equal to 90%.
One Sample Z Test (One-tailed)
A phone company claims that at least 90% of its customers are satisfied with their service. To test this claim, an independent researcher gathered a simple random sample of 200 customers and asked them if they are satisfied with their service, to which 176 responded yes.
Test the null hypothesis that at least 90% of customers are satisfied with their service against the alternative hypothesis that less than 90% of customers are satisfied with their service. Use a 0.1 level of significance.
The following screenshot shows how to perform a one-tailed one sample z test in Excel, along with the formulas used:
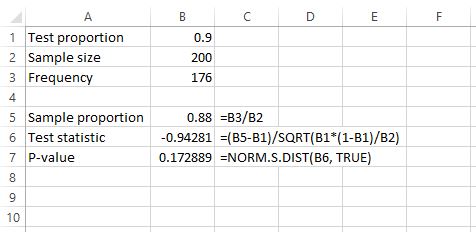
You need to fill in the values for cells B1:B3. Then, the values for cells B5:B7 are automatically calculated using the formulas shown in cells C5:C7.
Note that the formulas shown do the following:
- Formula in cell C5: This calculates the sample proportion using the formula Frequency / Sample size
- Formula in cell C6: This calculates the test statistic using the formula (p-P) / (√P(1-P) / n) where p is the sample proportion, P is the hypothesized population proportion, and n is the sample size.
- Formula in cell C6: This calculates the p-value associated with the test statistic calculated in cell B6 using the Excel function NORM.S.DIST, which returns the cumulative probability for the normal distribution with mean = 0 and standard deviation = 1.
Since the p-value (0.17) is greater than our chosen significance level of 0.1, we fail to reject the null hypothesis. We do not have sufficient evidence to say that the true percentage of customers who are satisfied with their service is less than 90%.