The mean of a dataset represents the average value of the dataset. It is calculated as:
Mean = Σxi / n
where:
- Σ: A symbol that means “sum”
- xi: The ith observation in a dataset
- n: The total number of observations in the dataset
The median represents the middle value of a dataset. It is calculated by arranging all of the observations in a dataset from smallest to largest and then identifying the middle value.
For example, suppose we have the following dataset with 11 observations:
Dataset: 3, 4, 4, 6, 7, 8, 12, 13, 15, 16, 17
The mean of the dataset is calculated as:
Mean = (3+4+4+6+7+8+12+13+15+16+17) / 11 = 9.54
The median of the dataset is the value directly in the middle, which turns out to be 8:
3, 4, 4, 6, 7, 8, 12, 13, 15, 16, 17
Both the mean and the median estimate where the center of a dataset is located. However, depending on the nature of the data, either the mean or the median may be more useful for describing the center of the dataset.
When to Use the Mean
It’s best to use the mean to describe the center of a dataset when the distribution is mostly symmetrical and there are no outliers.
For example, suppose we have the following distribution that shows the salaries of residents in a certain city:
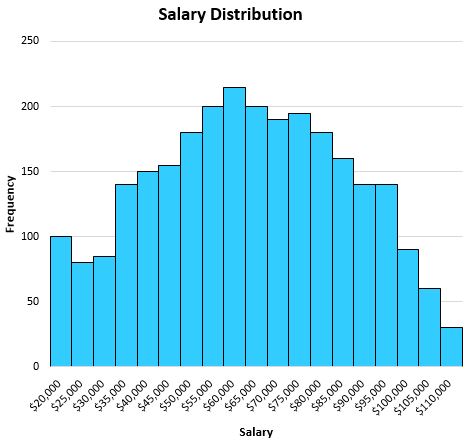
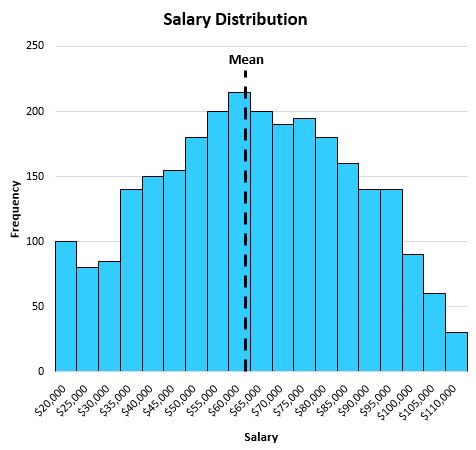
Since this distribution is fairly symmetrical (if you split it down the middle, each half would look roughly equal) and there are no outliers, we can use the mean to describe the center of this dataset.
The mean turns out to be $63,000, which is located approximately in the center of the distribution:
When to Use the Median
It is best to use the median when the distribution is either skewed or there are outliers present.
Skewed Data:
When a distribution is skewed, the median does a better job of describing the center of the distribution than the mean.
For example, consider the following distribution of salaries for residents in a certain city:
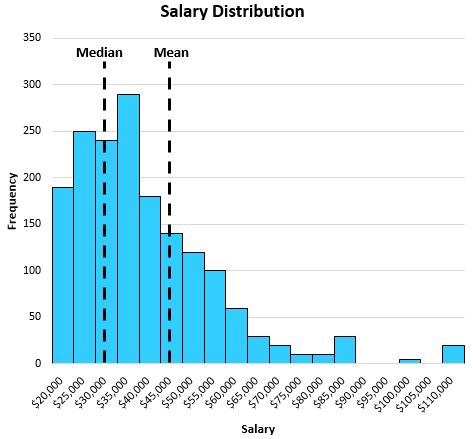
The median does a better job of capturing the “typical” salary of a resident than the mean. This is because the large values on the tail end of the distribution tend to pull the mean away from the center and towards the long tail.
In this example, the mean tells us that the typical individual earns about $47,000 per year while the median tells us that the typical individual only earns about $32,000 per year, which is much more representative of the typical individual.
Outliers:
The median also does a better job of capturing the central location of a distribution when there are outliers present in the data. For example, consider the following chart that shows the square footage of houses on a certain street:
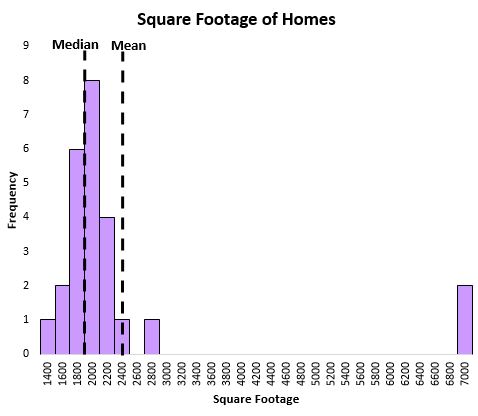
The mean is heavily influenced by a couple extremely large houses, while the median is not. Thus, the median does a better job of capturing the “typical” square footage of a house on this street compared to the mean.
Summary
In summary:
- Both the mean and the median can be used to describe where the “center” of a dataset is located.
- It’s best to use the mean when the distribution of the data values is symmetrical and there are no clear outliers.
- It’s best to use the median when the the distribution of data values is skewed or when there are clear outliers.
Additional Resources
How Do Outliers Affect the Mean?
How to Estimate the Mean and Median of Any Histogram
How to Find the Mean & Median of Stem-and-Leaf Plots